2021 Caldor Fire
Version: 2026.0
Case ID: FB001
FireBench IO std version: >= 1.0
Date of last update: 01/14/2025
Contributors
Aurélien Costes, Wildfire Interdisciplinary Research Center, San Jose State University, aurelien.costes@sjsu.edu, ORCID
Angel Farguell Caus, Wildfire Interdisciplinary Research Center, San Jose State University, angel.farguellcaus@sjsu.edu, ORCID
Adam Kochanski, Wildfire Interdisciplinary Research Center, San Jose State University, adam.kochanski@sjsu.edu, ORCID
Description
This collection of benchmarks uses the public resources about the 2021 Caldor Fire. It contains over 300 benchmarks on various datasets. It contains observation datasets for:
Building damaged (CALFIRE)
Burn severity (MTBS)
Burn severity (RAVG)
Canopy bottom height (LANDFIRE)
Canopy bulk density (LANDFIRE)
Canopy cover loss (RAVG)
Canopy height (LANDFIRE)
Infrared fire perimeters (NIROPS)
Live basal area change (RAVG)
Weather stations (Synoptic)
Buildings damage
Dataset
The data has been collected using CAL FIRE Damage Inspection (DINS) Data (version of 2025/11/05). The original CSV file containing multiple fires has been processed to extract only the buildings damaged by the Caldor Fire. The dataset includes the positions (lat, lon) of buildings within the area of influence of the fire. The state of buildings is one of the following:
‘No Damage’,
‘Affected (1-9%)’,
‘Minor (10-25%)’,
‘Major (26-50%)’,
‘Destroyed (>50%)’,
‘Inaccessible’.
The sha256 of the source file is: 0190a5a51aafafa20270fe046a7ae17a53697b1fb218ff8096a3d8ebbc9ef983.
If the evaluated model does not explicitly represent individual buildings, it should treat all buildings within a cell as sharing the cell value for building damage (deterministic models) or the median of the building damage distribution (probabilistic models).
Figure 1 shows the spatial distribution of building damage for the Caldor Fire.
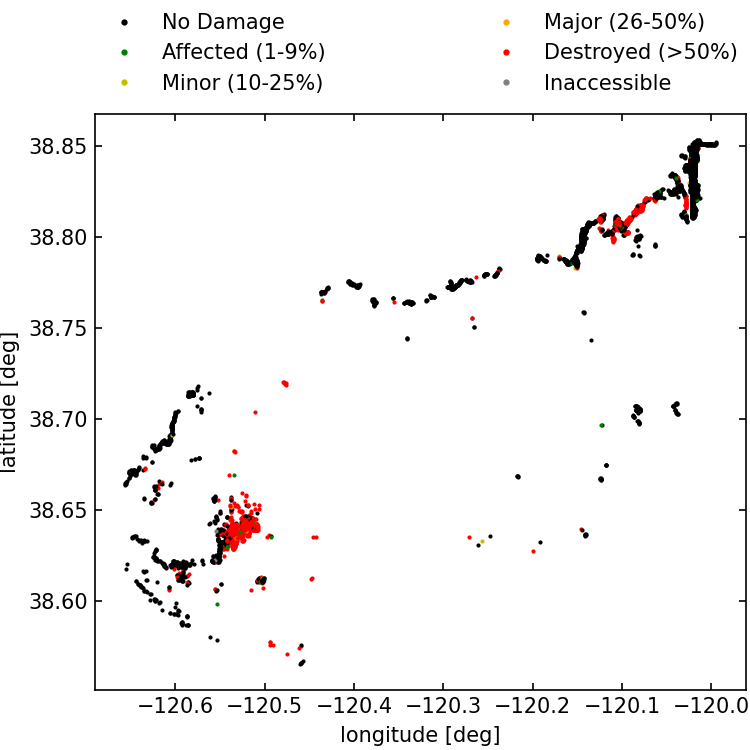
Fig. 1 : Building damage map
Figure 2 shows the distribution of building damage for the Caldor Fire. The following Table shows the number of structures in each damage category.
Damage category |
Counts [-] |
|---|---|
No Damage |
3356 |
Affected (1-9%) |
56 |
Minor (10-25%) |
18 |
Major (26-50%) |
7 |
Destroyed (>50%) |
1005 |
Inaccessible |
2 |
Total |
4444 |
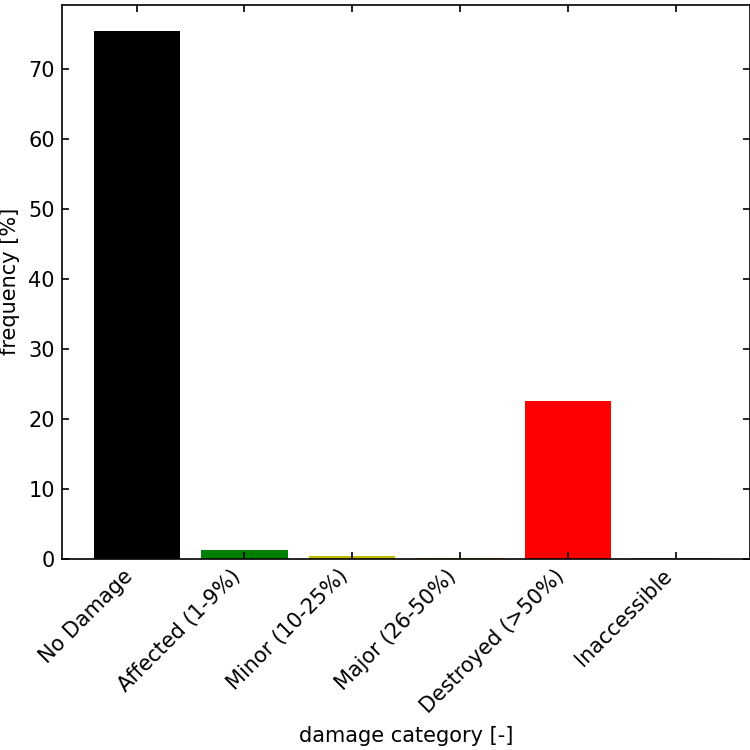
Fig. 2 : Distribution of buildings damage
Processing of dataset
Performed at obs dataset level
The data from the original CSV file were standardized without modification. The column names from the original csv file were corrected from “* Damage” to “Damage” and “* Incident Name” to “Incident Name” to simplify processing.
Binary classes of building damage
Performed at benchmark run level
To perform some calculations, the damaged building classes can be aggregated to form binary classes. The Inaccessible is ignored. The following aggregation method is used:
unburntbinary class containsNo Damage,Affected (1-9%), andMinor (10-25%),burntbinary class containsMajor (26-50%), andDestroyed (>50%).
Benchmarks
See Key Performance Indicator (KPI) and normalization definitions here.
Binary Structure Loss Accuracy
Short IDs: BD01
KPI: Binary Structure Loss Accuracy
Normalization: Linear Bounded Normalization with \(a=0\), \(b=1\)
Name in Score Card: Binary Structure Loss Accuracy
This benchmark is performed on the binary classes for damaged buildings.
Binary Structure Loss Precision
Short IDs: BD02
KPI: Binary Structure Loss Precision
Normalization: Linear Bounded Normalization with \(a=0\), \(b=1\)
Name in Score Card: Binary Structure Loss Precision
This benchmark is performed on the binary classes for damaged buildings.
Binary Structure Loss Recall
Short IDs: BD03
KPI: Binary Structure Loss Recall
Normalization: Linear Bounded Normalization with \(a=0\), \(b=1\)
Name in Score Card: Binary Structure Loss Recall
This benchmark is performed on the binary classes for damaged buildings.
Binary Structure Loss Specificity
Short IDs: BD04
KPI: Binary Structure Loss Specificity
Normalization: Linear Bounded Normalization with \(a=0\), \(b=1\)
Name in Score Card: Binary Structure Loss Specificity
This benchmark is performed on the binary classes for damaged buildings.
Binary Structure Loss Negative Predictive Value
Short IDs: BD05
KPI: Binary Structure Loss Negative Predictive Value
Normalization: Linear Bounded Normalization with \(a=0\), \(b=1\)
Name in Score Card: Binary Structure Loss Negative Predictive Value
This benchmark is performed on the binary classes for damaged buildings.
Binary Structure Loss F1 Score
Short IDs: BD06
KPI: Binary Structure Loss F1 Score
Normalization: Linear Bounded Normalization with \(a=0\), \(b=1\)
Name in Score Card: Binary Structure Loss F1 Score
This benchmark is performed on the binary classes for damaged buildings.
Burn severity from MTBS
Dataset
The data has been collected using Monitoring Trends in Burning Severity (MTBS).
The original zip file contains burn severity, pre/post burn images, and the final fire perimeter.
The source of the burn severity used in FireBench is the file ca3858612053820210815_20210805_20220723_dnbr6.tif. The source of the final fire perimeter is the kmz file ca3858612053820210815_20210805_20220723.kmz.
The burn severity categories, described with the corresponding index used in the dataset, are the following:
‘no data’: 0
‘unburnt to low’: 1
‘low’: 2
‘moderate’: 3
‘high’: 4
‘increased greenness’: 5
The hashes of the original source files are:
zip file: 171b9604c0654d8612eaabcfcad93d2374762661ab34b4d62718630a13469841
tif dnbr6: 33db74d3c5798c41ff3a4fc5ee57da9105fdc7a75d7f8af0d053d2f82cfdc0b6
final perimeter kmz: 4ed7a0ee585f8118b65a29375a3d5ee8a69e85a95ee155205ba5d781289c6e2b
Figure 3 shows the MTBS map from the original source.
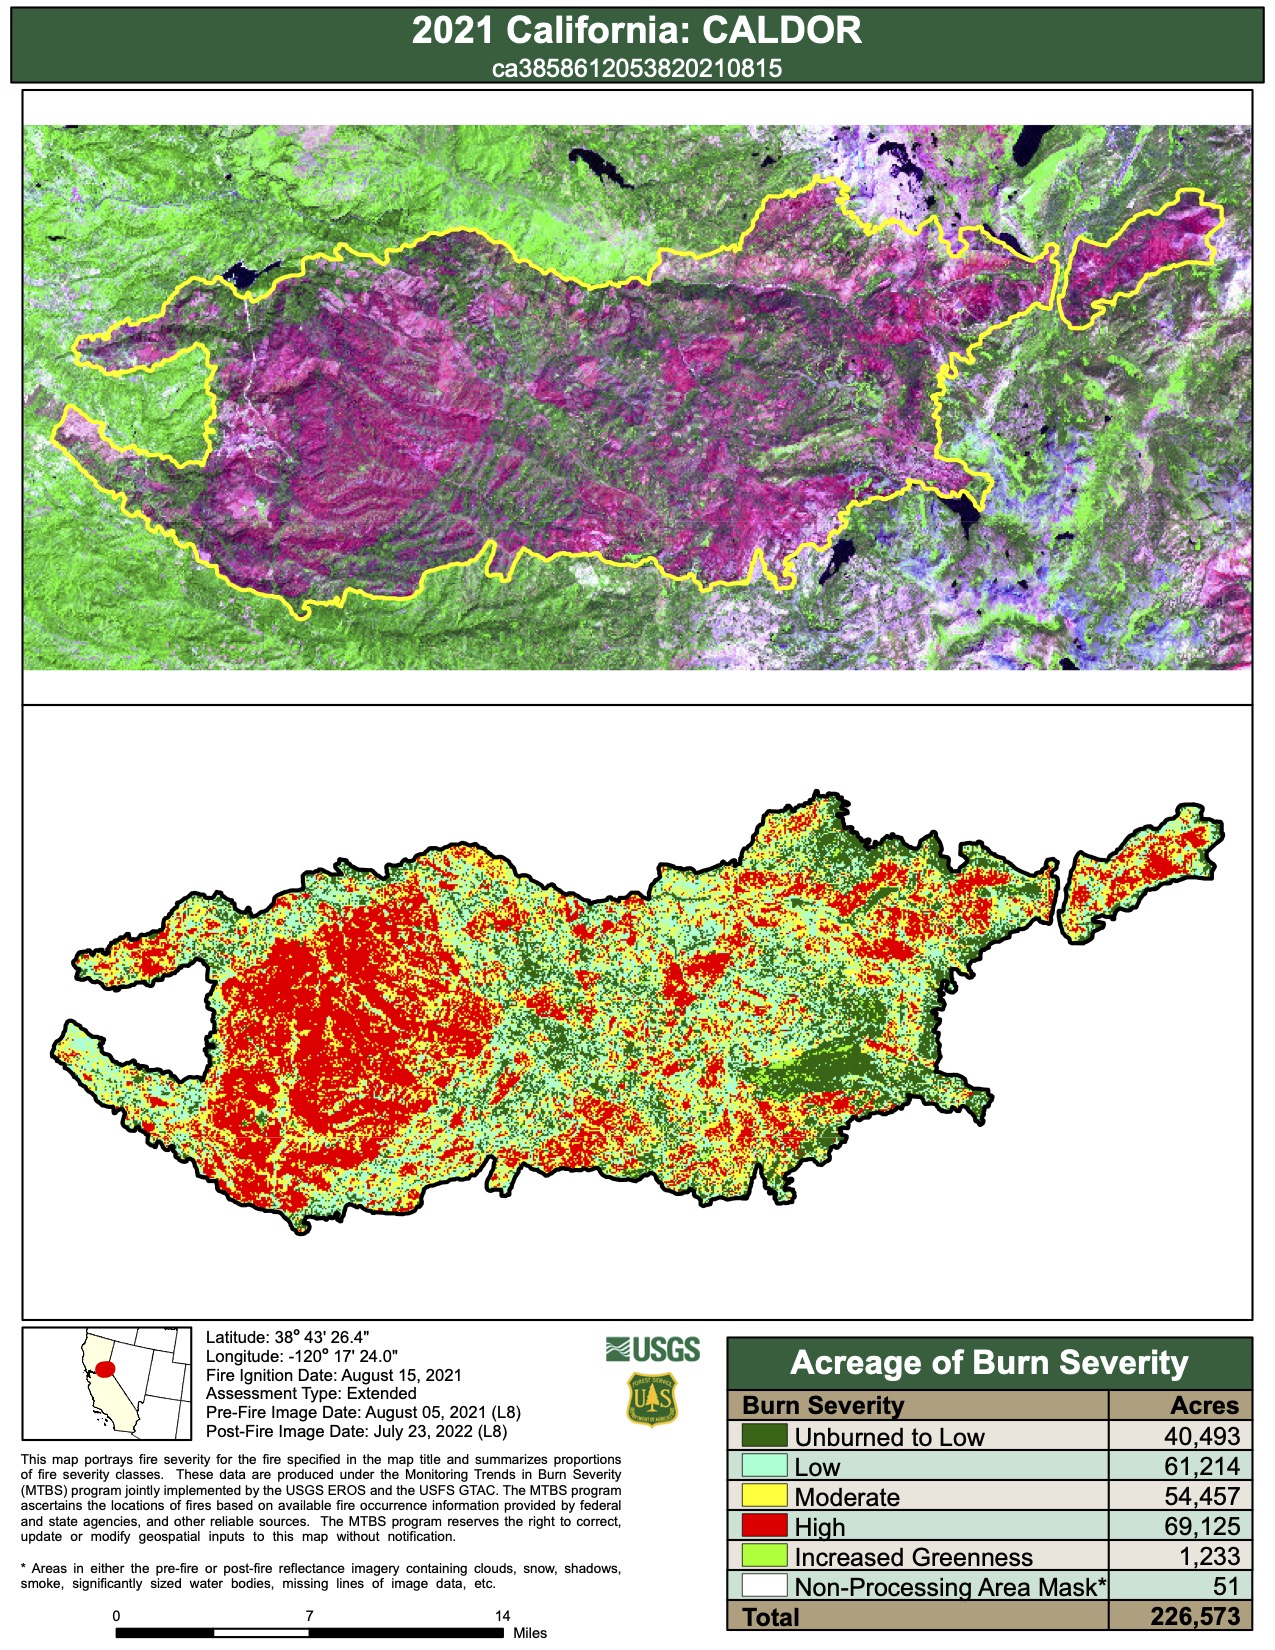
Fig. 3 : Map of burn severity from MTBS. Source: MTBS (`ca3858612053820210815_map.pdf`)
Processing of dataset
Performed at obs dataset level
The burn severity array is extracted from the original file without any modification. The latitude and longitude array are reconstructed using projection parameters (see firebench.standardize.mtbs.standardize_mtbs_from_geotiff). The final perimeter has been processed using QGIS. The original data (kmz file) has been imported and cleaned. Extra perimeters have been removed to conserve only the final fire perimeter. No modification to the polygons has been performed. Then, the multipolygons were exported to kml format and integrated into the dataset HDF5 file.
Binary classes for high severity
Performed at benchmark run level
To perform the high-severity benchmarks using a binary confusion matrix, we construct a binary field based on the high-severity index. All points will have a burn severity of 4 (‘high’) and will be assigned the value 1. The other points are assigned a value of 0. This processing is done when the benchmark is performed.
Benchmarks
See Key Performance Indicator (KPI) and normalization definitions here.
Binary High Severity Accuracy
Short IDs: SV01
KPI: Binary High Severity Accuracy
Normalization: Linear Bounded Normalization with \(a=0\), \(b=1\)
Name in Score Card: Binary High Severity Accuracy
This benchmark is performed on the binary classes for high severity points (Binary High severity processed variable)
Binary High Severity Precision
Short IDs: SV02
KPI: Binary High Severity Precision
Normalization: Linear Bounded Normalization with \(a=0\), \(b=1\)
Name in Score Card: Binary High Severity Precision
This benchmark is performed on the binary classes for high severity points (Binary High severity processed variable)
Binary High Severity Recall
Short IDs: SV03
KPI: Binary High Severity Recall
Normalization: Linear Bounded Normalization with \(a=0\), \(b=1\)
Name in Score Card: Binary High Severity Recall
This benchmark is performed on the binary classes for high severity points (Binary High severity processed variable)
Binary High Severity Specificity
Short IDs: SV04
KPI: Binary High Severity Specificity
Normalization: Linear Bounded Normalization with \(a=0\), \(b=1\)
Name in Score Card: Binary High Severity Specificity
This benchmark is performed on the binary classes for high severity points (Binary High severity processed variable)
Binary High Severity Negative Predictive Value
Short IDs: SV05
KPI: Binary High Severity Negative Predictive Value
Normalization: Linear Bounded Normalization with \(a=0\), \(b=1\)
Name in Score Card: Binary High Severity Negative Predictive Value
This benchmark is performed on the binary classes for high severity points (Binary High severity processed variable)
Binary High Severity F1 Score
Short IDs: SV06
KPI: Binary High Severity F1 Score
Normalization: Linear Bounded Normalization with \(a=0\), \(b=1\)
Name in Score Card: Binary High Severity F1 Score
This benchmark is performed on the binary classes for high severity points (Binary High severity processed variable)
Canopy cover loss
Dataset
The data has been collected using Rapid Assessment of Vegetation Condition after Wildfire (RAVG).
The source of the canopy cover loss used in FireBench is the dataset over CONUS for 2021, ravg_2021_cc5.tif. The region around the Caldor Fire has been processed and standardized using the following bounding box:
south west: (38.4, -120.8)
north east: (39.0, -119.7)
The canopy cover loss categories, described with the corresponding index used in the dataset, are the following:
‘Unmappable’: 0
‘0%’: 1
‘>0-<25%’: 2
‘25-<50%’: 3
‘50-<75%’: 4
‘75-100%’: 5
‘Outide burn area’: 9
In addition, a bounding box has been used to remove the data from another fire (forced to 0):
south west: (38.6, -119.9)
north east: (38.805, -119.7)
Figure 4 shows the processed RAVG dataset available in FireBench.
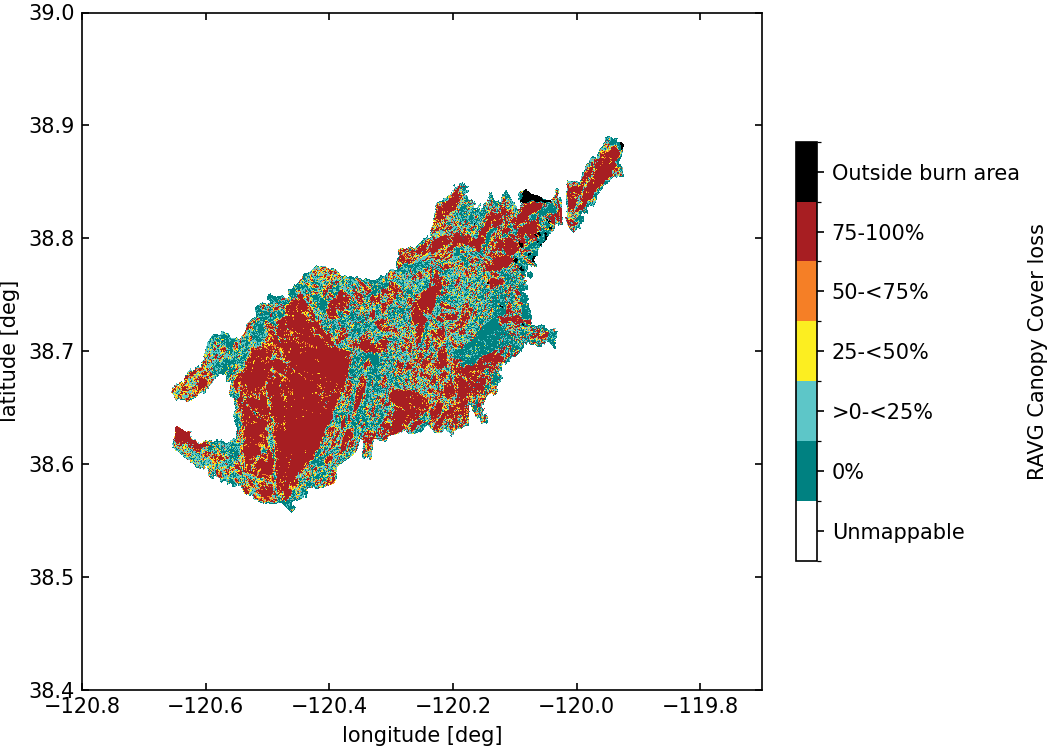
Fig. 4 : Map of standardized canopy cover loss from RAVG for Caldor Fire.
Processing of dataset
Performed at obs dataset level
A bounding box has been used to remove the data from another fire (forced to 0):
south west: (38.6, -119.9)
north east: (38.805, -119.7)
Masking using LANDFIRE dataset
Performed at benchmark run level
To perform an evaluation of high canopy cover loss, a mask is defined using three LANDFIRE datasets:
Canopy bulk density
Canopy height
Canopy bottom height
The variable masked high binary canopy cover loss used in various benchmarks is computed only where all LANDFIRE canopy variables (interpolated using the nearest method on the RAVG grid) are strictly greater than 0 (presence of canopy fuel) and is defined as a binary variable:
1if RAVG canopy cover loss value is5,0if RAVG canopy cover loss value is between1and4,nanotherwise.
Figure 5 shows the processed masked high binary canopy cover loss dataset used for related benchmarks.
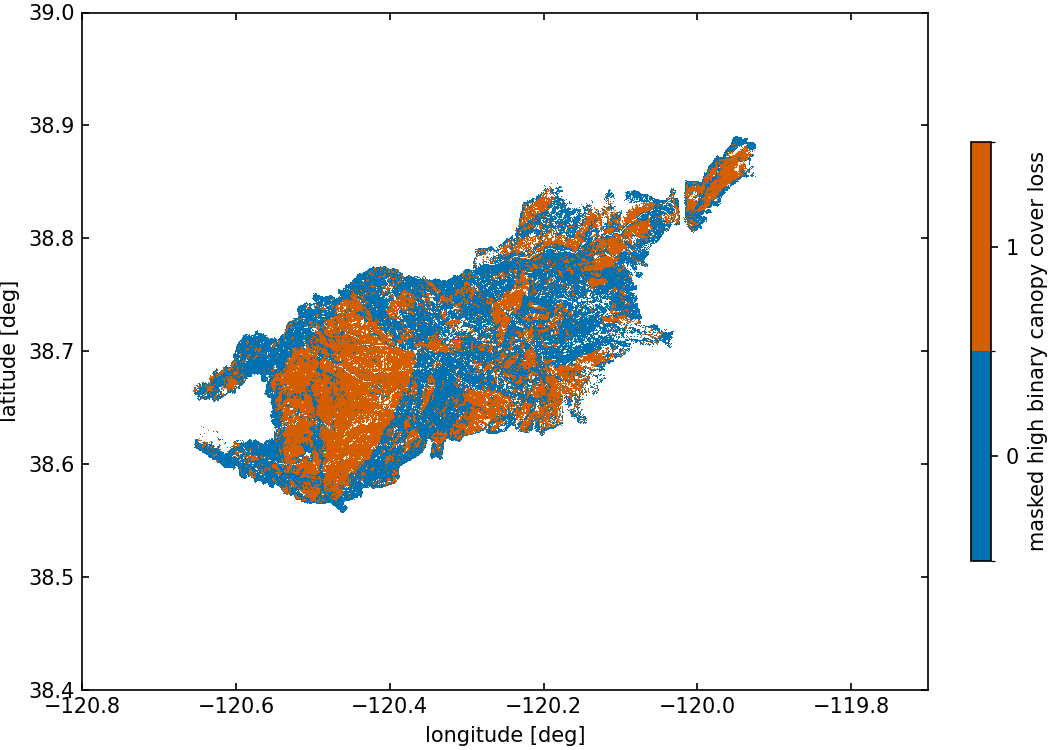
Fig. 5 : Map of standardized canopy cover loss from RAVG for Caldor Fire.
Benchmarks
See Key Performance Indicator (KPI) and normalization definitions here.
Masked High Binary Canopy Cover Loss Accuracy
Short IDs: CC01
KPI: Binary High Canopy Cover Loss Accuracy
Normalization: Linear Bounded Normalization with \(a=0\), \(b=1\)
Name in Score Card: Binary High Canopy Cover Loss Accuracy
This benchmark is performed on the binary classes masked high binary canopy cover loss.
Masked High Binary Canopy Cover Precision
Short IDs: CC02
KPI: Binary High Canopy Cover Loss Precision
Normalization: Linear Bounded Normalization with \(a=0\), \(b=1\)
Name in Score Card: Binary High Canopy Cover Loss Precision
This benchmark is performed on the binary classes masked high binary canopy cover loss.
Masked High Binary Canopy Cover Recall
Short IDs: CC03
KPI: Binary High Canopy Cover Loss Recall
Normalization: Linear Bounded Normalization with \(a=0\), \(b=1\)
Name in Score Card: Binary High Canopy Cover Loss Recall
This benchmark is performed on the binary classes masked high binary canopy cover loss.
Masked High Binary Canopy Cover Specificity
Short IDs: CC04
KPI: Binary High Canopy Cover Loss Specificity
Normalization: Linear Bounded Normalization with \(a=0\), \(b=1\)
Name in Score Card: Binary High Canopy Cover Loss Specificity
This benchmark is performed on the binary classes masked high binary canopy cover loss.
Masked High Binary Canopy Cover Negative Predictive Value
Short IDs: CC05
KPI: Binary High Canopy Cover Loss Negative Predictive Value
Normalization: Linear Bounded Normalization with \(a=0\), \(b=1\)
Name in Score Card: Binary High Canopy Cover Loss Negative Predictive Value
This benchmark is performed on the binary classes masked high binary canopy cover loss.
Masked High Binary Canopy Cover F1 Score
Short IDs: CC06
KPI: Binary High Canopy Cover Loss F1 Score
Normalization: Linear Bounded Normalization with \(a=0\), \(b=1\)
Name in Score Card: Binary High Canopy Cover Loss F1 Score
This benchmark is performed on the binary classes masked high binary canopy cover loss.
Infrared fire perimeters
Dataset
The infrared fire perimeters have been gathered from NIROPS dataset.
Every orginal file has been manually processed to extract only the perimeter. The time stamp of the perimeter has been defined from the imaging report (e.g. Report for 2021/08/17) using the Imagery Date and Imagery Time. The burn area obtained using the KML file and python tools has been verified against the Interpreted Acreage when specified in the reports. Each fire perimeter (see Fig. 6) is stored as a group within the HDF5 data file with attributes containing the path of the KML file that contains the fire perimeter dataset.
The perimeters have been processed from August 17th (first IR perimeter available) to September 10th, when the burn area is 99% if the final burn area, as shown in Figure 7 (source: CALFIRE).
The final dataset contains 21 perimeters.
The following study periods (see Fig. 7) are defined in the following Table:
Name |
Start time |
End time |
Duration |
Burn area [acre] |
|---|---|---|---|---|
W1 |
Aug 17 20h20 PDT |
Sep 10 23h34 PDT |
24d 3h 14min |
166,256 |
W2 |
Aug 19 20h45 PDT |
Aug 21 21h15 PDT |
2d 0h 30min |
24,941 |
W3 |
Aug 26 02h30 PDT |
Aug 28 20h30 PDT |
2d 18h 0min |
19,992 |
W4 |
Aug 28 20h30 PDT |
Sep 3 00h40 PDT |
5d 4h 10min |
56,272 |
Figure 6 shows the processed fire perimeter as a colored solid contour. The color of the contour indicates the timestamp of the perimeter.
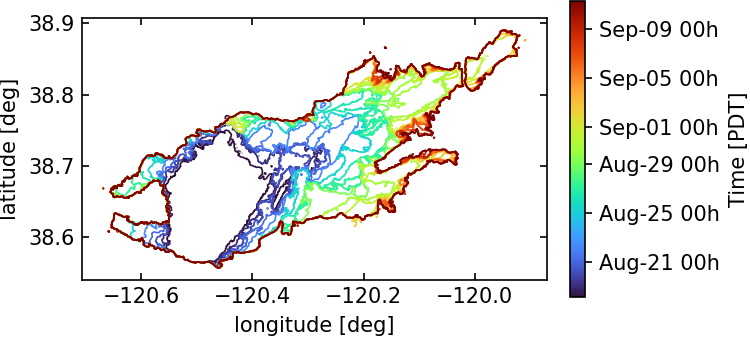
Fig. 6 : Infrared fire perimeters from August 17th to September 10th.
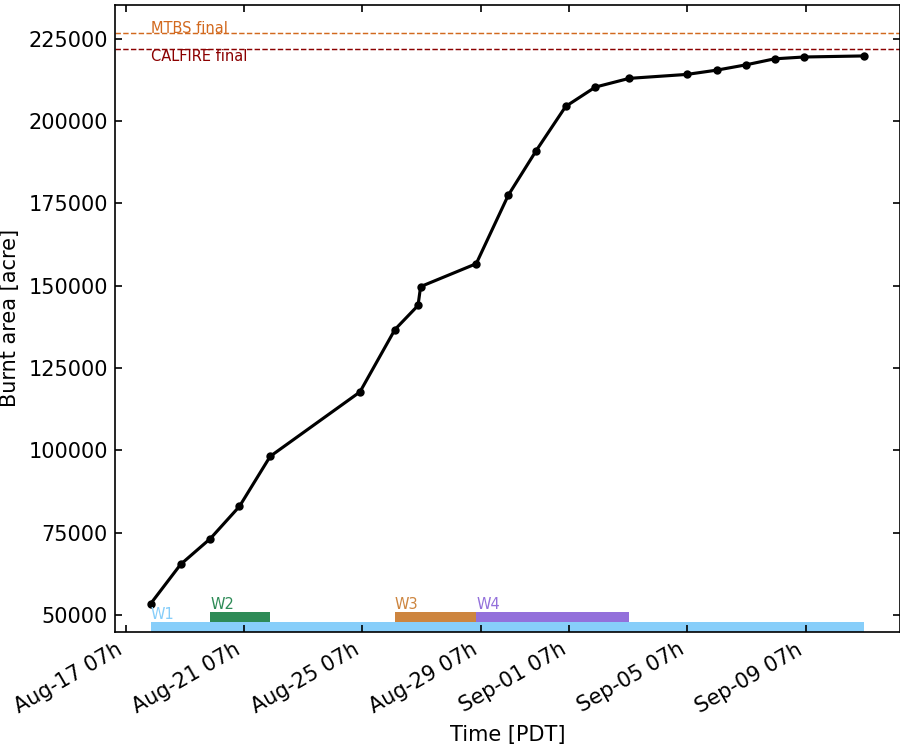
Fig. 7 : Burn area derived from IR perimeters from August 17th to September 10th. The red dashed line shows the final burn area from CALFIRE. The orange dashed line shows the final burn area from the MTBS final perimeter.
Benchmarks
See Key Performance Indicator (KPI) and normalization definitions here.
Average Jaccard Index over study period
Short IDs: See Table
KPI: Average Jaccard Index
Normalization: Linear Bounded Normalization with \(a=0\), \(b=1\)
Name in Score Card: See Table
The first perimeter at the start of the period can serve as an initial condition for the fire perimeter. The first perimeter is not used to compute any metric.
The area preserving project used is EPSG:5070.
The following Table gives the correspondence between the benchmark ID and the study period:
ID |
Study period |
Name in Score Card |
|---|---|---|
FP01 |
W1 |
Average Jaccard Index W1 |
FP02 |
W2 |
Average Jaccard Index W2 |
FP03 |
W3 |
Average Jaccard Index W3 |
FP04 |
W4 |
Average Jaccard Index W4 |
Minimum Jaccard Index over study period
Short IDs: See Table
KPI: Minimum Jaccard Index
Normalization: Linear Bounded Normalization with \(a=0\), \(b=1\)
Name in Score Card: See Table
The first perimeter at the start of the period can serve as an initial condition for the fire perimeter. The first perimeter is not used to compute any metric.
The area preserving project used is EPSG:5070.
The following Table gives the correspondence between the benchmark ID and the study period:
ID |
Study period |
Name in Score Card |
|---|---|---|
FP05 |
W1 |
Minimum Jaccard Index W1 |
FP06 |
W2 |
Minimum Jaccard Index W2 |
FP07 |
W3 |
Minimum Jaccard Index W3 |
FP08 |
W4 |
Minimum Jaccard Index W4 |
Maximum Jaccard Index over study period
Short IDs: See Table
KPI: Maximum Jaccard Index
Normalization: Linear Bounded Normalization with \(a=0\), \(b=1\)
Name in Score Card: See Table
The first perimeter at the start of the period can serve as an initial condition for the fire perimeter. The first perimeter is not used to compute any metric.
The area preserving project used is EPSG:5070.
The following Table gives the correspondence between the benchmark ID and the study period:
ID |
Study period |
Name in Score Card |
|---|---|---|
FP09 |
W1 |
Minimum Jaccard Index W1 |
FP10 |
W2 |
Minimum Jaccard Index W2 |
FP11 |
W3 |
Minimum Jaccard Index W3 |
FP12 |
W4 |
Minimum Jaccard Index W4 |
Average Dice-Sorensen Index over study period
Short IDs: See Table
KPI: Average Dice-Sorensen Index
Normalization: Linear Bounded Normalization with \(a=0\), \(b=1\)
Name in Score Card: See Table
The first perimeter at the start of the period can serve as an initial condition for the fire perimeter. The first perimeter is not used to compute any metric.
The area preserving project used is EPSG:5070.
The following Table gives the correspondence between the benchmark ID and the study period:
ID |
Study period |
Name in Score Card |
|---|---|---|
FP13 |
W1 |
Average Dice-Sorensen Index W1 |
FP14 |
W2 |
Average Dice-Sorensen Index W2 |
FP15 |
W3 |
Average Dice-Sorensen Index W3 |
FP16 |
W4 |
Average Dice-Sorensen Index W4 |
Minimum Dice-Sorensen Index over study period
Short IDs: See Table
KPI: Minimum Dice-Sorensen Index
Normalization: Linear Bounded Normalization with \(a=0\), \(b=1\)
Name in Score Card: See Table
The first perimeter at the start of the period can serve as an initial condition for the fire perimeter. The first perimeter is not used to compute any metric.
The area preserving project used is EPSG:5070.
The following Table gives the correspondence between the benchmark ID and the study period:
ID |
Study period |
Name in Score Card |
|---|---|---|
FP17 |
W1 |
Minimum Dice-Sorensen Index W1 |
FP18 |
W2 |
Minimum Dice-Sorensen Index W2 |
FP19 |
W3 |
Minimum Dice-Sorensen Index W3 |
FP20 |
W4 |
Minimum Dice-Sorensen Index W4 |
Maximum Dice-Sorensen Index over study period
Short IDs: See Table
KPI: Maximum Dice-Sorensen Index
Normalization: Linear Bounded Normalization with \(a=0\), \(b=1\)
Name in Score Card: See Table
The first perimeter at the start of the period can serve as an initial condition for the fire perimeter. The first perimeter is not used to compute any metric.
The area preserving project used is EPSG:5070.
The following Table gives the correspondence between the benchmark ID and the study period:
ID |
Study period |
Name in Score Card |
|---|---|---|
FP21 |
W1 |
Minimum Dice-Sorensen Index W1 |
FP22 |
W2 |
Minimum Dice-Sorensen Index W2 |
FP23 |
W3 |
Minimum Dice-Sorensen Index W3 |
FP24 |
W4 |
Minimum Dice-Sorensen Index W4 |
Final Burn Area Bias
Short IDs: See Table
KPI: Burn Area Bias
Normalization: Symmetric Exponential Open Normalization (\(m\) value in Table)
Name in Score Card: See Table
The first perimeter, at the start of the period, can be used as initial condition for the fire perimeter.
The bias is calculated on the last perimeter of the study period as the difference between the model and the observed burn area.
A bias of \(m\) acres, representing \(B_{50}\)% of burn area during the study period, will lead to a score of 50.00. The value of \(m\) represents the benchmark difficulty (smaller \(m\) means greater difficulty) and must be chosen by the community.
The following Table gives the correspondence between the benchmark ID and the study period:
ID |
Study period |
Name in Score Card |
\(m\) |
\(B_{50}\) |
|---|---|---|---|---|
FP25 |
W1 |
Burn Area Bias W1 |
80,000 |
48% |
FP26 |
W2 |
Burn Area Bias W2 |
5,000 |
20% |
FP27 |
W3 |
Burn Area Bias W3 |
5,000 |
25% |
FP28 |
W4 |
Burn Area Bias W4 |
17,000 |
30% |
Burn Area RMSE
Short IDs: See Table
KPI: Burn Area RMSE
Normalization: Symmetric Exponential Open Normalization (\(m\) value in Table)
Name in Score Card: See Table
The first perimeter, at the start of the period, can be used as initial condition for the fire perimeter.
A bias of \(m\) acres, representing \(B_{50}\)% of burn area during the study period, will lead to a score of 50.00. The value of \(m\) represents the benchmark difficulty (smaller \(m\) means greater difficulty) and must be chosen by the community.
The following Table gives the correspondence between the benchmark ID and the study period:
ID |
Study period |
Name in Score Card |
\(m\) |
\(B_{50}\) |
|---|---|---|---|---|
FP29 |
W1 |
Burn Area RMSE W1 |
80,000 |
48% |
FP30 |
W2 |
Burn Area RMSE W2 |
5,000 |
20% |
FP31 |
W3 |
Burn Area RMSE W3 |
5,000 |
25% |
FP32 |
W4 |
Burn Area RMSE W4 |
17,000 |
30% |
Weather stations
Dataset
Weather stations datasets have been gathered from Synoptics. All the stations available in the following bounding box have been processed:
south west: (38.4, -120.8)
north east: (39.0, -119.7)
The following variables have been processed (following FireBench namespace):
air_temperature
relative_humidity
solar_radiation
fuel_moisture_content_10h
wind_direction
wind_gust
wind_speed
Note
If you want to process more variables or require new benchmarks for existing variables, please reach out to the FireBench team to integrate these changes into a future version of the benchmarks.
Some stations don’t have data for the period W1 and have been excluded from the dataset. The list of excluded stations for missing data in the study period is: 403_PG, 412_PG, 413_PG, F9934. Also, some stations did not meet the data quality criterion and have been excluded from the dataset. The list of excluded stations for data quality reasons is: AV833, BLCC1, C9148, COOPDAGN2, COOPMINN2, FOIC1, FPDC1, G0658, GEOC1, LNLC1, PFHC1, SBKC1, SLPC1, STAN2, UTRC1, WDFC1, XOHC1.
Sensor height data has been extracted following the sensor height priority rules defined here. The current version of knowledge about sensor heights for the case weather stations are:
10 stations with a complete dataset (sensor height found in the source file)
98 stations with missing metadata
21 stations skipped
81 datasets with sensor height metadata
0 datasets from trusted stations from the FireBench database
0 datasets from trusted history from the FireBench database
5 datasets from the FireBench provider default database
394 datasets using FireBench default metadata
Therefore, 81 datasets are considered trusted and will be used in the benchmarks trusted source only (TSO).
All 399 datasets are used in benchmarks “all sources”.
Note
If you have information about sensor height and want to help increase the number of trusted datasets, please get in touch with the FireBench Team.
Weather stations are stored in the HDF5 file using their STID.
Benchmarks
See Key Performance Indicator (KPI) and normalization definitions here.
Air temperature
Short IDs: See Table
KPI: Air temperature MAE/RMSE/Bias
Normalization: Symmetric Exponential Open Normalization (\(m\) value in Table)
Name in Score Card: See Table
Each metric (MAE, RMSE, Bias) is calculated for each station for both model and observational dataset for a specified period. Then we apply summary statistics (e.g., min, mean, Q3) across all available weather stations before applying the normalization.
Implementation of metrics are firebench.metrics.stats.mae, firebench.metrics.stats.rmse, firebench.metrics.stats.bias.
Datasets are converted into degC for comparison.
The normalization parameter \(m\) sets which KPI value gives a Score of 50. It represents the difficulty of the benchmark.
The following Table gives the correspondence between the benchmark ID and the study period:
ID |
Study period |
Summary stats func |
Name in Score Card |
\(m\) |
trusted source only |
|---|---|---|---|---|---|
WX001 |
W1 |
MAE |
Air temp MAE min W1 TSO |
5.0 degC |
False |
WX002 |
W1 |
MAE |
Air temp MAE mean W1 TSO |
5.0 degC |
False |
WX003 |
W1 |
MAE |
Air temp MAE max W1 TSO |
5.0 degC |
False |
WX004 |
W1 |
MAE |
Air temp MAE min W1 |
5.0 degC |
True |
WX005 |
W1 |
MAE |
Air temp MAE mean W1 |
5.0 degC |
True |
WX006 |
W1 |
MAE |
Air temp MAE max W1 |
5.0 degC |
True |
WX007 |
W1 |
RMSE |
Air temp RMSE min W1 TSO |
5.0 degC |
False |
WX008 |
W1 |
RMSE |
Air temp RMSE mean W1 TSO |
5.0 degC |
False |
WX009 |
W1 |
RMSE |
Air temp RMSE max W1 TSO |
5.0 degC |
False |
WX010 |
W1 |
RMSE |
Air temp RMSE min W1 |
5.0 degC |
True |
WX011 |
W1 |
RMSE |
Air temp RMSE mean W1 |
5.0 degC |
True |
WX012 |
W1 |
RMSE |
Air temp RMSE max W1 |
5.0 degC |
True |
WX013 |
W1 |
Bias |
Air temp Bias min W1 TSO |
5.0 degC |
False |
WX014 |
W1 |
Bias |
Air temp Bias mean W1 TSO |
5.0 degC |
False |
WX015 |
W1 |
Bias |
Air temp Bias max W1 TSO |
5.0 degC |
False |
WX016 |
W1 |
Bias |
Air temp Bias min W1 |
5.0 degC |
True |
WX017 |
W1 |
Bias |
Air temp Bias mean W1 |
5.0 degC |
True |
WX018 |
W1 |
Bias |
Air temp Bias max W1 |
5.0 degC |
True |
WX019 |
W2 |
MAE |
Air temp MAE min W2 TSO |
5.0 degC |
False |
WX020 |
W2 |
MAE |
Air temp MAE mean W2 TSO |
5.0 degC |
False |
WX021 |
W2 |
MAE |
Air temp MAE max W2 TSO |
5.0 degC |
False |
WX022 |
W2 |
MAE |
Air temp MAE min W2 |
5.0 degC |
True |
WX023 |
W2 |
MAE |
Air temp MAE mean W2 |
5.0 degC |
True |
WX024 |
W2 |
MAE |
Air temp MAE max W2 |
5.0 degC |
True |
WX025 |
W2 |
RMSE |
Air temp RMSE min W2 TSO |
5.0 degC |
False |
WX026 |
W2 |
RMSE |
Air temp RMSE mean W2 TSO |
5.0 degC |
False |
WX027 |
W2 |
RMSE |
Air temp RMSE max W2 TSO |
5.0 degC |
False |
WX028 |
W2 |
RMSE |
Air temp RMSE min W2 |
5.0 degC |
True |
WX029 |
W2 |
RMSE |
Air temp RMSE mean W2 |
5.0 degC |
True |
WX030 |
W2 |
RMSE |
Air temp RMSE max W2 |
5.0 degC |
True |
WX031 |
W2 |
Bias |
Air temp Bias min W2 TSO |
5.0 degC |
False |
WX032 |
W2 |
Bias |
Air temp Bias mean W2 TSO |
5.0 degC |
False |
WX033 |
W2 |
Bias |
Air temp Bias max W2 TSO |
5.0 degC |
False |
WX034 |
W2 |
Bias |
Air temp Bias min W2 |
5.0 degC |
True |
WX035 |
W2 |
Bias |
Air temp Bias mean W2 |
5.0 degC |
True |
WX036 |
W2 |
Bias |
Air temp Bias max W2 |
5.0 degC |
True |
WX037 |
W3 |
MAE |
Air temp MAE min W3 TSO |
5.0 degC |
False |
WX038 |
W3 |
MAE |
Air temp MAE mean W3 TSO |
5.0 degC |
False |
WX039 |
W3 |
MAE |
Air temp MAE max W3 TSO |
5.0 degC |
False |
WX040 |
W3 |
MAE |
Air temp MAE min W3 |
5.0 degC |
True |
WX041 |
W3 |
MAE |
Air temp MAE mean W3 |
5.0 degC |
True |
WX042 |
W3 |
MAE |
Air temp MAE max W3 |
5.0 degC |
True |
WX043 |
W3 |
RMSE |
Air temp RMSE min W3 TSO |
5.0 degC |
False |
WX044 |
W3 |
RMSE |
Air temp RMSE mean W3 TSO |
5.0 degC |
False |
WX045 |
W3 |
RMSE |
Air temp RMSE max W3 TSO |
5.0 degC |
False |
WX046 |
W3 |
RMSE |
Air temp RMSE min W3 |
5.0 degC |
True |
WX047 |
W3 |
RMSE |
Air temp RMSE mean W3 |
5.0 degC |
True |
WX048 |
W3 |
RMSE |
Air temp RMSE max W3 |
5.0 degC |
True |
WX049 |
W3 |
Bias |
Air temp Bias min W3 TSO |
5.0 degC |
False |
WX050 |
W3 |
Bias |
Air temp Bias mean W3 TSO |
5.0 degC |
False |
WX051 |
W3 |
Bias |
Air temp Bias max W3 TSO |
5.0 degC |
False |
WX052 |
W3 |
Bias |
Air temp Bias min W3 |
5.0 degC |
True |
WX053 |
W3 |
Bias |
Air temp Bias mean W3 |
5.0 degC |
True |
WX054 |
W3 |
Bias |
Air temp Bias max W3 |
5.0 degC |
True |
WX055 |
W4 |
MAE |
Air temp MAE min W4 TSO |
5.0 degC |
False |
WX056 |
W4 |
MAE |
Air temp MAE mean W4 TSO |
5.0 degC |
False |
WX057 |
W4 |
MAE |
Air temp MAE max W4 TSO |
5.0 degC |
False |
WX058 |
W4 |
MAE |
Air temp MAE min W4 |
5.0 degC |
True |
WX059 |
W4 |
MAE |
Air temp MAE mean W4 |
5.0 degC |
True |
WX060 |
W4 |
MAE |
Air temp MAE max W4 |
5.0 degC |
True |
WX061 |
W4 |
RMSE |
Air temp RMSE min W4 TSO |
5.0 degC |
False |
WX062 |
W4 |
RMSE |
Air temp RMSE mean W4 TSO |
5.0 degC |
False |
WX063 |
W4 |
RMSE |
Air temp RMSE max W4 TSO |
5.0 degC |
False |
WX064 |
W4 |
RMSE |
Air temp RMSE min W4 |
5.0 degC |
True |
WX065 |
W4 |
RMSE |
Air temp RMSE mean W4 |
5.0 degC |
True |
WX066 |
W4 |
RMSE |
Air temp RMSE max W4 |
5.0 degC |
True |
WX067 |
W4 |
Bias |
Air temp Bias min W4 TSO |
5.0 degC |
False |
WX068 |
W4 |
Bias |
Air temp Bias mean W4 TSO |
5.0 degC |
False |
WX069 |
W4 |
Bias |
Air temp Bias max W4 TSO |
5.0 degC |
False |
WX070 |
W4 |
Bias |
Air temp Bias min W4 |
5.0 degC |
True |
WX071 |
W4 |
Bias |
Air temp Bias mean W4 |
5.0 degC |
True |
WX072 |
W4 |
Bias |
Air temp Bias max W4 |
5.0 degC |
True |
Relative Humidity
Short IDs: See Table
KPI: Relative humidity MAE/RMSE/Bias
Normalization: Symmetric Exponential Open Normalization (\(m\) value in Table)
Name in Score Card: See Table
Each metric (MAE, RMSE, Bias) is calculated for each station for both model and observational dataset for a specified period. Then we apply summary statistics (e.g., min, mean, Q3) across all available weather stations before applying the normalization.
Implementation of metrics are firebench.metrics.stats.mae, firebench.metrics.stats.rmse, firebench.metrics.stats.bias.
Datasets are converted into percent for comparison.
The normalization parameter \(m\) sets which KPI value gives a Score of 50. It represents the difficulty of the benchmark.
The following Table gives the correspondence between the benchmark ID and the study period:
ID |
Study period |
Summary stats func |
Name in Score Card |
\(m\) |
trusted source only |
|---|---|---|---|---|---|
WX073 |
W1 |
MAE |
RH MAE min W1 TSO |
15.0 percent |
False |
WX074 |
W1 |
MAE |
RH MAE mean W1 TSO |
15.0 percent |
False |
WX075 |
W1 |
MAE |
RH MAE max W1 TSO |
15.0 percent |
False |
WX076 |
W1 |
MAE |
RH MAE min W1 |
15.0 percent |
True |
WX077 |
W1 |
MAE |
RH MAE mean W1 |
15.0 percent |
True |
WX078 |
W1 |
MAE |
RH MAE max W1 |
15.0 percent |
True |
WX079 |
W1 |
RMSE |
RH RMSE min W1 TSO |
15.0 percent |
False |
WX080 |
W1 |
RMSE |
RH RMSE mean W1 TSO |
15.0 percent |
False |
WX081 |
W1 |
RMSE |
RH RMSE max W1 TSO |
15.0 percent |
False |
WX082 |
W1 |
RMSE |
RH RMSE min W1 |
15.0 percent |
True |
WX083 |
W1 |
RMSE |
RH RMSE mean W1 |
15.0 percent |
True |
WX084 |
W1 |
RMSE |
RH RMSE max W1 |
15.0 percent |
True |
WX085 |
W1 |
Bias |
RH Bias min W1 TSO |
15.0 percent |
False |
WX086 |
W1 |
Bias |
RH Bias mean W1 TSO |
15.0 percent |
False |
WX087 |
W1 |
Bias |
RH Bias max W1 TSO |
15.0 percent |
False |
WX088 |
W1 |
Bias |
RH Bias min W1 |
15.0 percent |
True |
WX089 |
W1 |
Bias |
RH Bias mean W1 |
15.0 percent |
True |
WX090 |
W1 |
Bias |
RH Bias max W1 |
15.0 percent |
True |
WX091 |
W2 |
MAE |
RH MAE min W2 TSO |
15.0 percent |
False |
WX092 |
W2 |
MAE |
RH MAE mean W2 TSO |
15.0 percent |
False |
WX093 |
W2 |
MAE |
RH MAE max W2 TSO |
15.0 percent |
False |
WX094 |
W2 |
MAE |
RH MAE min W2 |
15.0 percent |
True |
WX095 |
W2 |
MAE |
RH MAE mean W2 |
15.0 percent |
True |
WX096 |
W2 |
MAE |
RH MAE max W2 |
15.0 percent |
True |
WX097 |
W2 |
RMSE |
RH RMSE min W2 TSO |
15.0 percent |
False |
WX098 |
W2 |
RMSE |
RH RMSE mean W2 TSO |
15.0 percent |
False |
WX099 |
W2 |
RMSE |
RH RMSE max W2 TSO |
15.0 percent |
False |
WX100 |
W2 |
RMSE |
RH RMSE min W2 |
15.0 percent |
True |
WX101 |
W2 |
RMSE |
RH RMSE mean W2 |
15.0 percent |
True |
WX102 |
W2 |
RMSE |
RH RMSE max W2 |
15.0 percent |
True |
WX103 |
W2 |
Bias |
RH Bias min W2 TSO |
15.0 percent |
False |
WX104 |
W2 |
Bias |
RH Bias mean W2 TSO |
15.0 percent |
False |
WX105 |
W2 |
Bias |
RH Bias max W2 TSO |
15.0 percent |
False |
WX106 |
W2 |
Bias |
RH Bias min W2 |
15.0 percent |
True |
WX107 |
W2 |
Bias |
RH Bias mean W2 |
15.0 percent |
True |
WX108 |
W2 |
Bias |
RH Bias max W2 |
15.0 percent |
True |
WX109 |
W3 |
MAE |
RH MAE min W3 TSO |
15.0 percent |
False |
WX110 |
W3 |
MAE |
RH MAE mean W3 TSO |
15.0 percent |
False |
WX111 |
W3 |
MAE |
RH MAE max W3 TSO |
15.0 percent |
False |
WX112 |
W3 |
MAE |
RH MAE min W3 |
15.0 percent |
True |
WX113 |
W3 |
MAE |
RH MAE mean W3 |
15.0 percent |
True |
WX114 |
W3 |
MAE |
RH MAE max W3 |
15.0 percent |
True |
WX115 |
W3 |
RMSE |
RH RMSE min W3 TSO |
15.0 percent |
False |
WX116 |
W3 |
RMSE |
RH RMSE mean W3 TSO |
15.0 percent |
False |
WX117 |
W3 |
RMSE |
RH RMSE max W3 TSO |
15.0 percent |
False |
WX118 |
W3 |
RMSE |
RH RMSE min W3 |
15.0 percent |
True |
WX119 |
W3 |
RMSE |
RH RMSE mean W3 |
15.0 percent |
True |
WX120 |
W3 |
RMSE |
RH RMSE max W3 |
15.0 percent |
True |
WX121 |
W3 |
Bias |
RH Bias min W3 TSO |
15.0 percent |
False |
WX122 |
W3 |
Bias |
RH Bias mean W3 TSO |
15.0 percent |
False |
WX123 |
W3 |
Bias |
RH Bias max W3 TSO |
15.0 percent |
False |
WX124 |
W3 |
Bias |
RH Bias min W3 |
15.0 percent |
True |
WX125 |
W3 |
Bias |
RH Bias mean W3 |
15.0 percent |
True |
WX126 |
W3 |
Bias |
RH Bias max W3 |
15.0 percent |
True |
WX127 |
W4 |
MAE |
RH MAE min W4 TSO |
15.0 percent |
False |
WX128 |
W4 |
MAE |
RH MAE mean W4 TSO |
15.0 percent |
False |
WX129 |
W4 |
MAE |
RH MAE max W4 TSO |
15.0 percent |
False |
WX130 |
W4 |
MAE |
RH MAE min W4 |
15.0 percent |
True |
WX131 |
W4 |
MAE |
RH MAE mean W4 |
15.0 percent |
True |
WX132 |
W4 |
MAE |
RH MAE max W4 |
15.0 percent |
True |
WX133 |
W4 |
RMSE |
RH RMSE min W4 TSO |
15.0 percent |
False |
WX134 |
W4 |
RMSE |
RH RMSE mean W4 TSO |
15.0 percent |
False |
WX135 |
W4 |
RMSE |
RH RMSE max W4 TSO |
15.0 percent |
False |
WX136 |
W4 |
RMSE |
RH RMSE min W4 |
15.0 percent |
True |
WX137 |
W4 |
RMSE |
RH RMSE mean W4 |
15.0 percent |
True |
WX138 |
W4 |
RMSE |
RH RMSE max W4 |
15.0 percent |
True |
WX139 |
W4 |
Bias |
RH Bias min W4 TSO |
15.0 percent |
False |
WX140 |
W4 |
Bias |
RH Bias mean W4 TSO |
15.0 percent |
False |
WX141 |
W4 |
Bias |
RH Bias max W4 TSO |
15.0 percent |
False |
WX142 |
W4 |
Bias |
RH Bias min W4 |
15.0 percent |
True |
WX143 |
W4 |
Bias |
RH Bias mean W4 |
15.0 percent |
True |
WX144 |
W4 |
Bias |
RH Bias max W4 |
15.0 percent |
True |
Wind Speed
Short IDs: See Table
KPI: Wind Speed MAE/RMSE/Bias
Normalization: Symmetric Exponential Open Normalization (\(m\) value in Table)
Name in Score Card: See Table
Each metric (MAE, RMSE, Bias) is calculated for each station for both model and observational dataset for a specified period. Then we apply summary statistics (e.g., min, mean, Q3) across all available weather stations before applying the normalization.
Implementation of metrics are firebench.metrics.stats.mae, firebench.metrics.stats.rmse, firebench.metrics.stats.bias.
Datasets are converted into m/s for comparison.
The normalization parameter \(m\) sets which KPI value gives a Score of 50. It represents the difficulty of the benchmark.
The following Table gives the correspondence between the benchmark ID and the study period:
ID |
Study period |
Summary stats func |
Name in Score Card |
\(m\) |
trusted source only |
|---|---|---|---|---|---|
WX145 |
W1 |
MAE |
Wind Speed MAE min W1 TSO |
5.0 m/s |
False |
WX146 |
W1 |
MAE |
Wind Speed MAE mean W1 TSO |
5.0 m/s |
False |
WX147 |
W1 |
MAE |
Wind Speed MAE max W1 TSO |
5.0 m/s |
False |
WX148 |
W1 |
MAE |
Wind Speed MAE min W1 |
5.0 m/s |
True |
WX149 |
W1 |
MAE |
Wind Speed MAE mean W1 |
5.0 m/s |
True |
WX150 |
W1 |
MAE |
Wind Speed MAE max W1 |
5.0 m/s |
True |
WX151 |
W1 |
RMSE |
Wind Speed RMSE min W1 TSO |
5.0 m/s |
False |
WX152 |
W1 |
RMSE |
Wind Speed RMSE mean W1 TSO |
5.0 m/s |
False |
WX153 |
W1 |
RMSE |
Wind Speed RMSE max W1 TSO |
5.0 m/s |
False |
WX154 |
W1 |
RMSE |
Wind Speed RMSE min W1 |
5.0 m/s |
True |
WX155 |
W1 |
RMSE |
Wind Speed RMSE mean W1 |
5.0 m/s |
True |
WX156 |
W1 |
RMSE |
Wind Speed RMSE max W1 |
5.0 m/s |
True |
WX157 |
W1 |
Bias |
Wind Speed Bias min W1 TSO |
5.0 m/s |
False |
WX158 |
W1 |
Bias |
Wind Speed Bias mean W1 TSO |
5.0 m/s |
False |
WX159 |
W1 |
Bias |
Wind Speed Bias max W1 TSO |
5.0 m/s |
False |
WX160 |
W1 |
Bias |
Wind Speed Bias min W1 |
5.0 m/s |
True |
WX161 |
W1 |
Bias |
Wind Speed Bias mean W1 |
5.0 m/s |
True |
WX162 |
W1 |
Bias |
Wind Speed Bias max W1 |
5.0 m/s |
True |
WX163 |
W2 |
MAE |
Wind Speed MAE min W2 TSO |
5.0 m/s |
False |
WX164 |
W2 |
MAE |
Wind Speed MAE mean W2 TSO |
5.0 m/s |
False |
WX165 |
W2 |
MAE |
Wind Speed MAE max W2 TSO |
5.0 m/s |
False |
WX166 |
W2 |
MAE |
Wind Speed MAE min W2 |
5.0 m/s |
True |
WX167 |
W2 |
MAE |
Wind Speed MAE mean W2 |
5.0 m/s |
True |
WX168 |
W2 |
MAE |
Wind Speed MAE max W2 |
5.0 m/s |
True |
WX169 |
W2 |
RMSE |
Wind Speed RMSE min W2 TSO |
5.0 m/s |
False |
WX170 |
W2 |
RMSE |
Wind Speed RMSE mean W2 TSO |
5.0 m/s |
False |
WX171 |
W2 |
RMSE |
Wind Speed RMSE max W2 TSO |
5.0 m/s |
False |
WX172 |
W2 |
RMSE |
Wind Speed RMSE min W2 |
5.0 m/s |
True |
WX173 |
W2 |
RMSE |
Wind Speed RMSE mean W2 |
5.0 m/s |
True |
WX174 |
W2 |
RMSE |
Wind Speed RMSE max W2 |
5.0 m/s |
True |
WX175 |
W2 |
Bias |
Wind Speed Bias min W2 TSO |
5.0 m/s |
False |
WX176 |
W2 |
Bias |
Wind Speed Bias mean W2 TSO |
5.0 m/s |
False |
WX177 |
W2 |
Bias |
Wind Speed Bias max W2 TSO |
5.0 m/s |
False |
WX178 |
W2 |
Bias |
Wind Speed Bias min W2 |
5.0 m/s |
True |
WX179 |
W2 |
Bias |
Wind Speed Bias mean W2 |
5.0 m/s |
True |
WX180 |
W2 |
Bias |
Wind Speed Bias max W2 |
5.0 m/s |
True |
WX181 |
W3 |
MAE |
Wind Speed MAE min W3 TSO |
5.0 m/s |
False |
WX182 |
W3 |
MAE |
Wind Speed MAE mean W3 TSO |
5.0 m/s |
False |
WX183 |
W3 |
MAE |
Wind Speed MAE max W3 TSO |
5.0 m/s |
False |
WX184 |
W3 |
MAE |
Wind Speed MAE min W3 |
5.0 m/s |
True |
WX185 |
W3 |
MAE |
Wind Speed MAE mean W3 |
5.0 m/s |
True |
WX186 |
W3 |
MAE |
Wind Speed MAE max W3 |
5.0 m/s |
True |
WX187 |
W3 |
RMSE |
Wind Speed RMSE min W3 TSO |
5.0 m/s |
False |
WX188 |
W3 |
RMSE |
Wind Speed RMSE mean W3 TSO |
5.0 m/s |
False |
WX189 |
W3 |
RMSE |
Wind Speed RMSE max W3 TSO |
5.0 m/s |
False |
WX190 |
W3 |
RMSE |
Wind Speed RMSE min W3 |
5.0 m/s |
True |
WX191 |
W3 |
RMSE |
Wind Speed RMSE mean W3 |
5.0 m/s |
True |
WX192 |
W3 |
RMSE |
Wind Speed RMSE max W3 |
5.0 m/s |
True |
WX193 |
W3 |
Bias |
Wind Speed Bias min W3 TSO |
5.0 m/s |
False |
WX194 |
W3 |
Bias |
Wind Speed Bias mean W3 TSO |
5.0 m/s |
False |
WX195 |
W3 |
Bias |
Wind Speed Bias max W3 TSO |
5.0 m/s |
False |
WX196 |
W3 |
Bias |
Wind Speed Bias min W3 |
5.0 m/s |
True |
WX197 |
W3 |
Bias |
Wind Speed Bias mean W3 |
5.0 m/s |
True |
WX198 |
W3 |
Bias |
Wind Speed Bias max W3 |
5.0 m/s |
True |
WX199 |
W4 |
MAE |
Wind Speed MAE min W4 TSO |
5.0 m/s |
False |
WX200 |
W4 |
MAE |
Wind Speed MAE mean W4 TSO |
5.0 m/s |
False |
WX201 |
W4 |
MAE |
Wind Speed MAE max W4 TSO |
5.0 m/s |
False |
WX202 |
W4 |
MAE |
Wind Speed MAE min W4 |
5.0 m/s |
True |
WX203 |
W4 |
MAE |
Wind Speed MAE mean W4 |
5.0 m/s |
True |
WX204 |
W4 |
MAE |
Wind Speed MAE max W4 |
5.0 m/s |
True |
WX205 |
W4 |
RMSE |
Wind Speed RMSE min W4 TSO |
5.0 m/s |
False |
WX206 |
W4 |
RMSE |
Wind Speed RMSE mean W4 TSO |
5.0 m/s |
False |
WX207 |
W4 |
RMSE |
Wind Speed RMSE max W4 TSO |
5.0 m/s |
False |
WX208 |
W4 |
RMSE |
Wind Speed RMSE min W4 |
5.0 m/s |
True |
WX209 |
W4 |
RMSE |
Wind Speed RMSE mean W4 |
5.0 m/s |
True |
WX210 |
W4 |
RMSE |
Wind Speed RMSE max W4 |
5.0 m/s |
True |
WX211 |
W4 |
Bias |
Wind Speed Bias min W4 TSO |
5.0 m/s |
False |
WX212 |
W4 |
Bias |
Wind Speed Bias mean W4 TSO |
5.0 m/s |
False |
WX213 |
W4 |
Bias |
Wind Speed Bias max W4 TSO |
5.0 m/s |
False |
WX214 |
W4 |
Bias |
Wind Speed Bias min W4 |
5.0 m/s |
True |
WX215 |
W4 |
Bias |
Wind Speed Bias mean W4 |
5.0 m/s |
True |
WX216 |
W4 |
Bias |
Wind Speed Bias max W4 |
5.0 m/s |
True |
Wind Direction
Short IDs: See Table
KPI: Wind Direction circular Bias
Normalization: Symmetric Exponential Open Normalization (\(m\) value in Table)
Name in Score Card: See Table
Each metric is calculated for each station for both model and observational dataset for a specified period. Then we apply summary statistics (e.g., min, mean, Q3) across all available weather stations before applying the normalization.
Implementation of metrics are firebench.metrics.stats.circular_bias_deg.
Datasets are converted into degree for comparison.
The normalization parameter \(m\) sets which KPI value gives a Score of 50. It represents the difficulty of the benchmark.
The following Table gives the correspondence between the benchmark ID and the study period:
ID |
Study period |
Summary stats func |
Name in Score Card |
\(m\) |
trusted source only |
|---|---|---|---|---|---|
WX217 |
W1 |
circular bias |
Wind Direction circular bias min W1 TSO |
45.0 degree |
False |
WX218 |
W1 |
circular bias |
Wind Direction circular bias mean W1 TSO |
45.0 degree |
False |
WX219 |
W1 |
circular bias |
Wind Direction circular bias max W1 TSO |
45.0 degree |
False |
WX220 |
W1 |
circular bias |
Wind Direction circular bias min W1 |
45.0 degree |
True |
WX221 |
W1 |
circular bias |
Wind Direction circular bias mean W1 |
45.0 degree |
True |
WX222 |
W1 |
circular bias |
Wind Direction circular bias max W1 |
45.0 degree |
True |
WX223 |
W2 |
circular bias |
Wind Direction circular bias min W2 TSO |
45.0 degree |
False |
WX224 |
W2 |
circular bias |
Wind Direction circular bias mean W2 TSO |
45.0 degree |
False |
WX225 |
W2 |
circular bias |
Wind Direction circular bias max W2 TSO |
45.0 degree |
False |
WX226 |
W2 |
circular bias |
Wind Direction circular bias min W2 |
45.0 degree |
True |
WX227 |
W2 |
circular bias |
Wind Direction circular bias mean W2 |
45.0 degree |
True |
WX228 |
W2 |
circular bias |
Wind Direction circular bias max W2 |
45.0 degree |
True |
WX229 |
W3 |
circular bias |
Wind Direction circular bias min W3 TSO |
45.0 degree |
False |
WX230 |
W3 |
circular bias |
Wind Direction circular bias mean W3 TSO |
45.0 degree |
False |
WX231 |
W3 |
circular bias |
Wind Direction circular bias max W3 TSO |
45.0 degree |
False |
WX232 |
W3 |
circular bias |
Wind Direction circular bias min W3 |
45.0 degree |
True |
WX233 |
W3 |
circular bias |
Wind Direction circular bias mean W3 |
45.0 degree |
True |
WX234 |
W3 |
circular bias |
Wind Direction circular bias max W3 |
45.0 degree |
True |
WX235 |
W4 |
circular bias |
Wind Direction circular bias min W4 TSO |
45.0 degree |
False |
WX236 |
W4 |
circular bias |
Wind Direction circular bias mean W4 TSO |
45.0 degree |
False |
WX237 |
W4 |
circular bias |
Wind Direction circular bias max W4 TSO |
45.0 degree |
False |
WX238 |
W4 |
circular bias |
Wind Direction circular bias min W4 |
45.0 degree |
True |
WX239 |
W4 |
circular bias |
Wind Direction circular bias mean W4 |
45.0 degree |
True |
WX240 |
W4 |
circular bias |
Wind Direction circular bias max W4 |
45.0 degree |
True |
Fuel Moisture Content 10h
Short IDs: See Table
KPI: FMC 10h MAE/RMSE/Bias
Normalization: Symmetric Exponential Open Normalization (\(m\) value in Table)
Name in Score Card: See Table
Each metric is calculated for each station for both model and observational dataset for a specified period. Then we apply summary statistics (e.g., min, mean, Q3) across all available weather stations before applying the normalization.
Implementation of metrics are firebench.metrics.stats.mae, firebench.metrics.stats.rmse, firebench.metrics.stats.bias.
Datasets are converted into percent for comparison.
The normalization parameter \(m\) sets which KPI value gives a Score of 50. It represents the difficulty of the benchmark.
The following Table gives the correspondence between the benchmark ID and the study period:
ID |
Study period |
Summary stats func |
Name in Score Card |
\(m\) |
trusted source only |
|---|---|---|---|---|---|
WX241 |
W1 |
MAE |
FMC 10h MAE min W1 TSO |
5.0 percent |
False |
WX242 |
W1 |
MAE |
FMC 10h MAE mean W1 TSO |
5.0 percent |
False |
WX243 |
W1 |
MAE |
FMC 10h MAE max W1 TSO |
5.0 percent |
False |
WX244 |
W1 |
MAE |
FMC 10h MAE min W1 |
5.0 percent |
True |
WX245 |
W1 |
MAE |
FMC 10h MAE mean W1 |
5.0 percent |
True |
WX246 |
W1 |
MAE |
FMC 10h MAE max W1 |
5.0 percent |
True |
WX247 |
W1 |
RMSE |
FMC 10h RMSE min W1 TSO |
5.0 percent |
False |
WX248 |
W1 |
RMSE |
FMC 10h RMSE mean W1 TSO |
5.0 percent |
False |
WX249 |
W1 |
RMSE |
FMC 10h RMSE max W1 TSO |
5.0 percent |
False |
WX250 |
W1 |
RMSE |
FMC 10h RMSE min W1 |
5.0 percent |
True |
WX251 |
W1 |
RMSE |
FMC 10h RMSE mean W1 |
5.0 percent |
True |
WX252 |
W1 |
RMSE |
FMC 10h RMSE max W1 |
5.0 percent |
True |
WX253 |
W1 |
Bias |
FMC 10h Bias min W1 TSO |
5.0 percent |
False |
WX254 |
W1 |
Bias |
FMC 10h Bias mean W1 TSO |
5.0 percent |
False |
WX255 |
W1 |
Bias |
FMC 10h Bias max W1 TSO |
5.0 percent |
False |
WX256 |
W1 |
Bias |
FMC 10h Bias min W1 |
5.0 percent |
True |
WX257 |
W1 |
Bias |
FMC 10h Bias mean W1 |
5.0 percent |
True |
WX258 |
W1 |
Bias |
FMC 10h Bias max W1 |
5.0 percent |
True |
WX259 |
W2 |
MAE |
FMC 10h MAE min W2 TSO |
5.0 percent |
False |
WX260 |
W2 |
MAE |
FMC 10h MAE mean W2 TSO |
5.0 percent |
False |
WX261 |
W2 |
MAE |
FMC 10h MAE max W2 TSO |
5.0 percent |
False |
WX262 |
W2 |
MAE |
FMC 10h MAE min W2 |
5.0 percent |
True |
WX263 |
W2 |
MAE |
FMC 10h MAE mean W2 |
5.0 percent |
True |
WX264 |
W2 |
MAE |
FMC 10h MAE max W2 |
5.0 percent |
True |
WX265 |
W2 |
RMSE |
FMC 10h RMSE min W2 TSO |
5.0 percent |
False |
WX266 |
W2 |
RMSE |
FMC 10h RMSE mean W2 TSO |
5.0 percent |
False |
WX267 |
W2 |
RMSE |
FMC 10h RMSE max W2 TSO |
5.0 percent |
False |
WX268 |
W2 |
RMSE |
FMC 10h RMSE min W2 |
5.0 percent |
True |
WX269 |
W2 |
RMSE |
FMC 10h RMSE mean W2 |
5.0 percent |
True |
WX270 |
W2 |
RMSE |
FMC 10h RMSE max W2 |
5.0 percent |
True |
WX271 |
W2 |
Bias |
FMC 10h Bias min W2 TSO |
5.0 percent |
False |
WX272 |
W2 |
Bias |
FMC 10h Bias mean W2 TSO |
5.0 percent |
False |
WX273 |
W2 |
Bias |
FMC 10h Bias max W2 TSO |
5.0 percent |
False |
WX274 |
W2 |
Bias |
FMC 10h Bias min W2 |
5.0 percent |
True |
WX275 |
W2 |
Bias |
FMC 10h Bias mean W2 |
5.0 percent |
True |
WX276 |
W2 |
Bias |
FMC 10h Bias max W2 |
5.0 percent |
True |
WX277 |
W3 |
MAE |
FMC 10h MAE min W3 TSO |
5.0 percent |
False |
WX278 |
W3 |
MAE |
FMC 10h MAE mean W3 TSO |
5.0 percent |
False |
WX279 |
W3 |
MAE |
FMC 10h MAE max W3 TSO |
5.0 percent |
False |
WX280 |
W3 |
MAE |
FMC 10h MAE min W3 |
5.0 percent |
True |
WX281 |
W3 |
MAE |
FMC 10h MAE mean W3 |
5.0 percent |
True |
WX282 |
W3 |
MAE |
FMC 10h MAE max W3 |
5.0 percent |
True |
WX283 |
W3 |
RMSE |
FMC 10h RMSE min W3 TSO |
5.0 percent |
False |
WX284 |
W3 |
RMSE |
FMC 10h RMSE mean W3 TSO |
5.0 percent |
False |
WX285 |
W3 |
RMSE |
FMC 10h RMSE max W3 TSO |
5.0 percent |
False |
WX286 |
W3 |
RMSE |
FMC 10h RMSE min W3 |
5.0 percent |
True |
WX287 |
W3 |
RMSE |
FMC 10h RMSE mean W3 |
5.0 percent |
True |
WX288 |
W3 |
RMSE |
FMC 10h RMSE max W3 |
5.0 percent |
True |
WX289 |
W3 |
Bias |
FMC 10h Bias min W3 TSO |
5.0 percent |
False |
WX290 |
W3 |
Bias |
FMC 10h Bias mean W3 TSO |
5.0 percent |
False |
WX291 |
W3 |
Bias |
FMC 10h Bias max W3 TSO |
5.0 percent |
False |
WX292 |
W3 |
Bias |
FMC 10h Bias min W3 |
5.0 percent |
True |
WX293 |
W3 |
Bias |
FMC 10h Bias mean W3 |
5.0 percent |
True |
WX294 |
W3 |
Bias |
FMC 10h Bias max W3 |
5.0 percent |
True |
WX295 |
W4 |
MAE |
FMC 10h MAE min W4 TSO |
5.0 percent |
False |
WX296 |
W4 |
MAE |
FMC 10h MAE mean W4 TSO |
5.0 percent |
False |
WX297 |
W4 |
MAE |
FMC 10h MAE max W4 TSO |
5.0 percent |
False |
WX298 |
W4 |
MAE |
FMC 10h MAE min W4 |
5.0 percent |
True |
WX299 |
W4 |
MAE |
FMC 10h MAE mean W4 |
5.0 percent |
True |
WX300 |
W4 |
MAE |
FMC 10h MAE max W4 |
5.0 percent |
True |
WX301 |
W4 |
RMSE |
FMC 10h RMSE min W4 TSO |
5.0 percent |
False |
WX302 |
W4 |
RMSE |
FMC 10h RMSE mean W4 TSO |
5.0 percent |
False |
WX303 |
W4 |
RMSE |
FMC 10h RMSE max W4 TSO |
5.0 percent |
False |
WX304 |
W4 |
RMSE |
FMC 10h RMSE min W4 |
5.0 percent |
True |
WX305 |
W4 |
RMSE |
FMC 10h RMSE mean W4 |
5.0 percent |
True |
WX306 |
W4 |
RMSE |
FMC 10h RMSE max W4 |
5.0 percent |
True |
WX307 |
W4 |
Bias |
FMC 10h Bias min W4 TSO |
5.0 percent |
False |
WX308 |
W4 |
Bias |
FMC 10h Bias mean W4 TSO |
5.0 percent |
False |
WX309 |
W4 |
Bias |
FMC 10h Bias max W4 TSO |
5.0 percent |
False |
WX310 |
W4 |
Bias |
FMC 10h Bias min W4 |
5.0 percent |
True |
WX311 |
W4 |
Bias |
FMC 10h Bias mean W4 |
5.0 percent |
True |
WX312 |
W4 |
Bias |
FMC 10h Bias max W4 |
5.0 percent |
True |
Requirements
The following sections list the datasets’ requirements to run the different benchmarks. When the benchmark script runs, each requirement is validated against the HDF5 file provided as input (from the model output/data the user wants to evaluate). If a requirement is met, each corresponding benchmark is run. Each requirement lists the required datasets/groups (as paths) and the mandatory attributes for each dataset/group. The current version of FireBench does not support more complex checks (e.g., array size and dtype).
Requirement |
Benchmarks |
|---|---|
R01 |
BD01 to BD06 |
R02 |
SV01 to SV06 |
R03 |
FP01, FP05, FP09, FP13, FP17, FP21, FP25, FP29 |
R04 |
FP02, FP06, FP10, FP14, FP18, FP22, FP26, FP30 |
R05 |
FP03, FP07, FP11, FP15, FP19, FP23, FP27, FP31 |
R06 |
FP04, FP08, FP12, FP16, FP20, FP24, FP28, FP32 |
R07 |
CC01 to CC06 |
R08 |
WX001 to WX072 |
R09 |
WX073 to WX144 |
R10 |
WX145 to WX216 |
R11 |
WX217 to WX240 |
R12 |
WX241 to WX312 |
R01
Mandatory group/dataset |
Mandatory attributes |
|---|---|
|
units |
R02
Mandatory group/dataset |
Mandatory attributes |
|---|---|
|
crs |
|
units, _FillValue |
|
units |
|
units |
R03
Mandatory group/dataset |
Mandatory attributes |
|---|---|
|
rel_path, time |
|
rel_path, time |
|
rel_path, time |
|
rel_path, time |
|
rel_path, time |
|
rel_path, time |
|
rel_path, time |
|
rel_path, time |
|
rel_path, time |
|
rel_path, time |
|
rel_path, time |
|
rel_path, time |
|
rel_path, time |
|
rel_path, time |
|
rel_path, time |
|
rel_path, time |
|
rel_path, time |
|
rel_path, time |
|
rel_path, time |
|
rel_path, time |
Files (KML) at path defined in rel_path attributes must exist.
R04
Mandatory group/dataset |
Mandatory attributes |
|---|---|
|
rel_path, time |
|
rel_path, time |
Files (KML) at path defined in rel_path attributes must exist.
R05
Mandatory group/dataset |
Mandatory attributes |
|---|---|
|
rel_path, time |
|
rel_path, time |
|
rel_path, time |
Files (KML) at path defined in rel_path attributes must exist.
R06
Mandatory group/dataset |
Mandatory attributes |
|---|---|
|
rel_path, time |
|
rel_path, time |
|
rel_path, time |
|
rel_path, time |
|
rel_path, time |
Files (KML) at path defined in rel_path attributes must exist.
R07
Mandatory group/dataset |
Mandatory attributes |
|---|---|
|
crs |
|
units, _FillValue |
|
units |
|
units |
R08
Verify that the model and observational datasets contain the same weather station groups with the following datasets:
Mandatory group/dataset |
Mandatory attributes |
|---|---|
|
None |
|
None |
R09
Verify that the model and observational datasets contain the same weather station groups with the following datasets:
Mandatory group/dataset |
Mandatory attributes |
|---|---|
|
None |
|
None |
R10
Verify that the model and observational datasets contain the same weather station groups with the following datasets:
Mandatory group/dataset |
Mandatory attributes |
|---|---|
|
None |
|
None |
R11
Verify that the model and observational datasets contain the same weather station groups with the following datasets:
Mandatory group/dataset |
Mandatory attributes |
|---|---|
|
None |
|
None |
R12
Verify that the model and observational datasets contain the same weather station groups with the following datasets:
Mandatory group/dataset |
Mandatory attributes |
|---|---|
|
None |
|
None |
Aggregation Schemes
This section describes the weights used to aggregate KPI unit scores. More information about aggregation methods here. If the aggregation scheme 0 is specified, then no aggregation is performed. Therefore, group scores and total scores are not computed.
Group definition
All benchmarks have a default weight of 1 in each group. If custom weights are applied, refer to the custom weight Table.
Weight precedence:
Default benchmark weight: 1
Group benchmark overrides: apply to all schemes unless overridden
Scheme benchmark overrides: apply only within that scheme and override everything else
Group |
Benchmark ID |
|---|---|
Building Damage |
BD01 to BD06 |
Burn Severity |
SV01 to SV06 |
Fire Perimeter W1 |
FP01, FP05, FP09, FP13, FP17, FP21, FP25, FP29 |
Fire Perimeter W2 |
FP02, FP06, FP10, FP14, FP18, FP22, FP26, FP30 |
Fire Perimeter W3 |
FP03, FP07, FP11, FP15, FP19, FP23, FP27, FP31 |
Fire Perimeter W4 |
FP04, FP08, FP12, FP16, FP20, FP24, FP28, FP32 |
Canopy Cover Loss |
CC01 to CC06 |
Air temperature W1 |
WX001 to WX018 |
Air temperature W2 |
WX019 to WX036 |
Air temperature W3 |
WX037 to WX054 |
Air temperature W4 |
WX055 to WX072 |
Relative humidity 10h W1 |
WX073 to WX090 |
Relative humidity 10h W2 |
WX091 to WX108 |
Relative humidity 10h W3 |
WX109 to WX126 |
Relative humidity 10h W4 |
WX127 to WX144 |
Wind speed W1 |
WX145 to WX162 |
Wind speed W2 |
WX163 to WX180 |
Wind speed W3 |
WX181 to WX198 |
Wind speed W4 |
WX199 to WX216 |
Wind direction W1 |
WX217 to WX222 |
Wind direction W2 |
WX223 to WX228 |
Wind direction W3 |
WX229 to WX234 |
Wind direction W4 |
WX235 to WX240 |
Fuel Moisture 10h W1 |
WX241 to WX258 |
Fuel Moisture 10h W2 |
WX259 to WX276 |
Fuel Moisture 10h W3 |
WX277 to WX294 |
Fuel Moisture 10h W4 |
WX295 to WX312 |
Scheme A
Scheme A contains all the groups with default weights. It can be used to evaluate complete model performance with balanced weighting.
Scheme B
Scheme B contains only the building damage group. It is used to evaluate the model only on building damage benchmarks.
Group |
Group Weight |
|---|---|
Building Damage |
1 |
Scheme CC
Scheme CC contains only the canopy cover loss group. It is used to evaluate crown fire models.
Group |
Group Weight |
|---|---|
Canopy Cover Loss |
1 |
Scheme FP
Scheme FP contains only the fire perimeter groups. It is used to evaluate the model only on fire perimeter benchmarks for all of the study periods.
Group |
Group Weight |
|---|---|
Fire Perimeter W1 |
1 |
Fire Perimeter W2 |
1 |
Fire Perimeter W3 |
1 |
Fire Perimeter W4 |
1 |
Scheme short_all
Scheme short_all contains all the groups except the groups relative to W1 study period. Therefore, the index i is in [2, 4].
Group |
Group Weight |
|---|---|
Air Temp Wi |
1 |
Building Damage |
1 |
Burn Severity |
1 |
Canopy Cover Loss |
1 |
Fire Perimeter Wi |
1 |
FMC 10h Wi |
1 |
RH Wi |
1 |
Wind Direction Wi |
1 |
Wind Speed Wi |
1 |
Scheme S
Scheme S contains only the burn severity group. It is used to evaluate the model only on building severity from MTBS benchmarks.
Group |
Group Weight |
|---|---|
Burn Severity |
1 |
Scheme WXi
Schemes WXi, for i in [1, 4], contains all the group related to weather stations for a specific study period (W1 to W4)
Group |
Group Weight |
|---|---|
Air Temp Wi |
1 |
FMC 10h Wi |
1 |
RH Wi |
1 |
Wind Direction Wi |
1 |
Wind Speed Wi |
1 |
Scheme WX_short
Scheme short_all contains all the groups except the groups relative to W1 study period and fire perimeter groups. Therefore, the index i is in [2, 4].
Group |
Group Weight |
|---|---|
Air Temp Wi |
1 |
Building Damage |
1 |
Burn Severity |
1 |
Canopy Cover Loss |
1 |
FMC 10h Wi |
1 |
RH Wi |
1 |
Wind Direction Wi |
1 |
Wind Speed Wi |
1 |
Notes
Benchmark identifiers consist of a case ID and a short ID, for example
FB001-BD01. Throughout the documentation, the short ID alone (e.g.BD01) is used when the benchmark case is unambiguous, in order to improve readability. The full identifier (FB001-BD01) is used whenever the case context must be explicit, such as when comparing benchmarks across different cases.Each file hash has been performed using
firebench.standardize.calculate_sha256.Collection of forecasts or reanalysis is authorized for the benchmark period (e.g., for fire perimeters) but has to be detailed in the model report attached to the Report sent back to the FireBench team for collection and validation of results.
Acknowledgment
We gratefully acknowledge Synoptic for granting permission to redistribute selected weather-station data as part of the FireBench benchmarking framework.
I would like to thank my colleague Muthu K. Selvaraj (WPI) for his help in this project.