ROS validation using Anderson 2015 dataset
Contributors
Aurélien Costes, Wildfire Interdisciplinary Research Center, San Jose State University, aurelien.costes@sjsu.edu, ORCID
Tags


Description
The goal is to assess the accuracy of various rate of spread (ROS) models by comparing their computed ROS values against observed data from the Anderson 2015 dataset. The dataset presented in [1] compiles shrubland fire behavior data from experimental studies conducted across Australia, New Zealand, Europe, and South Africa. It encompasses a wide range of heathland and shrubland vegetation types and structures. The dataset contains independent data from prescribed fires and wildfires. The accuracy is evaluated using RMSE, Pearson correlation and NMSE.
Data description
Input
The data for this benchmark is the compressed archive
firebench/data/benchmarks/fire_submodels/ROS_validation_using_Anderson_2015_dataset.tar.zst. This archive contains:data_ROS_validation_using_Anderson_2015.h5: main data file following the FireBench I/O standard 0.1. sha256: 18345579aa94da579fd0bb4131fdaaa26fa62d7bebe02816988820f7c7bb8966plot_and_metrics.py: Script to calculate metrics and create plots from standard output files from the benchmark and model’s output. sha256: d729b63846b14d6a201486d02e6fa79d39ab2f74603e49196da4c8500d5c7f32generate_data_benchmark.py: Script to generatedata_ROS_validation_using_Anderson_2015.h5from Anderson 2015 dataset. If some required inputs are not available in the provided dataset, it is allowed to add complementary data from the Scott and Burgan 40 fuel models. If the required data is not present in Scott and Burgan fuel model, it is allowed to use Anderson fuel model. sha256: 139be6db528a2475f943d256237643bd29d043d7223717782d182f9cf6d12b71run_rothermel_example.py: Example script to calculate the rate of spread for Anderson 2015 dataset using theRothermel_SFIRErate of spread model and save the date in a file compliant with the FireBench I/O standard 0.1. sha256: 89a1715194e2e152fd40aa521409903993cb2ddfdfb4a805c1dae13cd17bdca4
ROS_validation_using_Anderson_2015_dataset.tar.zst sha256: 8b4d736e3c6d9904e13c98d7bf3f388814759490f0ebcceec949499645283809
To uncompresse the archive, use tar --zstd -xf ROS_validation_using_Anderson_2015_dataset.tar.zst.
If the archive file does not appear in the data directory, use git lfs pull.
All of the data mentionned above is available within the package FireBench.
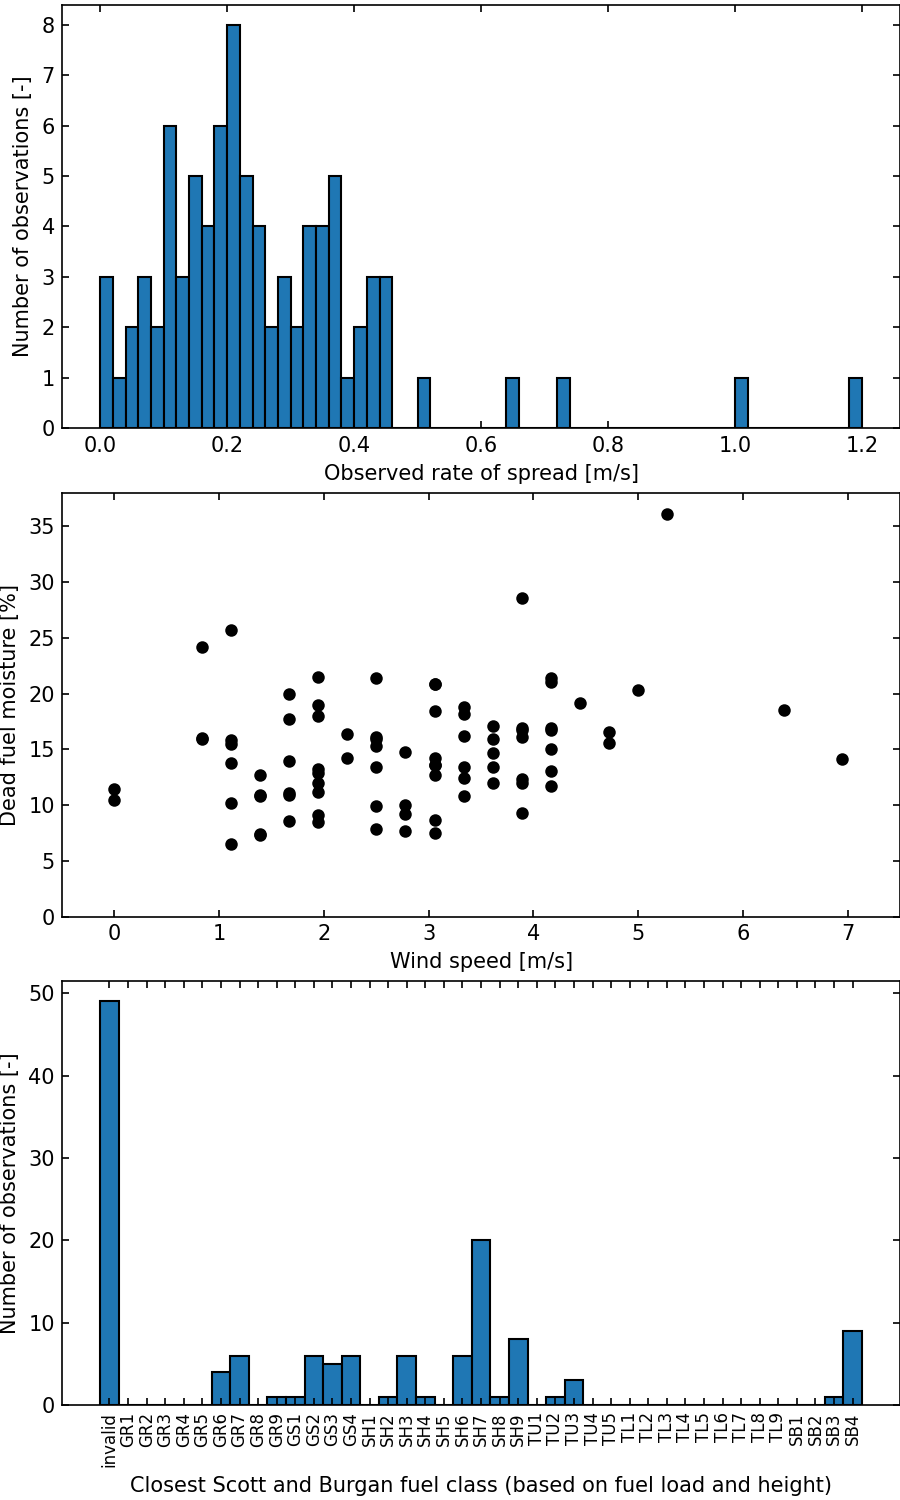
The following plot presents some statistics about the Anderson 2015 dataset.
The top panel shows the distribution of the rate of spread for valid observations (where the input data are complete to run a rate of spread model).
The middle panel shows the observation in a wind/fuel moisture space.
The bottom panel shows the distribution of the closest Scott and Burgan fuel catgeory based on fuel load and fuel height. The invalid category groups the observations where the fuel load or fuel heught information is not available.
You can generate this figure using firebench.stats.anderson_2015_stats using default parameters or change units for wind and rate of spread.
Expected output data
The workflow generates an output file in hdf5 format. The output file contains the expected and computed rate of spread.
Initial conditions and configuration
To add complementary data from Scott and Burgan fuel model, you need to select the category that represents at best the fuel from the Anderson 2015 dataset. To select which fuel category to use, employ the
firebench.tools.find_closest_fuel_class_by_propertiesfunction to identify the nearest fuel category. In this benchmark, useFUEL_LOAD_DRY_TOTALandFUEL_HEIGHT, and apply default weights to determine similarity.Apply the
Baughman_generalized_wind_reduction_factor_unshelteredmethod to compute the wind reduction factor, considering that the input wind measurements are taken above the vegetation canopy.
Metrics definition
The accuracy of the rate of spread model is evaluated using:
RMSE using
firebench.metrics.stats.rmse.NMSE with range normalization using
firebench.metrics.stats.nmse_range.Pearson correlation coefficient using
numpy.corrcoef.
Current Benchmark results
The following table summarize the results for different rate of spread models, and sort them by RMSE value.
Model |
Benchmark status |
RMSE [m/s] |
NMSE [-] |
Pearson correlation [-] |
|---|---|---|---|---|
Balbi_2022 |
|
0.67 |
0.56 |
0.53 |
Rothermel_SFIRE |
|
1.45 |
1.21 |
0.48 |


More information about benchmark results:
Publication status
The dataset for this benchmark is described in [1].
Licensing and Use Terms
As the data provided is prior to January 1st, 2024, the commercial use of this data requires explicit permission from the publisher. For more detailed information or to seek permissions, you can visit the CSIRO Publishing Open Access page.
Additional notes
The worklow template can be found at
firebench/workflow/rate_of_spread_models_analysis/01_01_Anderson_2015_validation.If you don’t find the content in the
datadirectory, trygit lfs pull.