Scores
This section details the processes used to construct a unique score for each benchmark case from the set of KPIs contained in the benchmark case.
A Score is defined as a real number, with 4 significant digit, between 0.000 (worst) and 100.0 (best).
Scores are derived from KPI values and allow the comparison of models and benchmark results.
As a KPI value is not necessarily a number that is compliant with the score definition, a normalization process is required to convert a KPI value to a score, called Unit Score.
The different normalization functions available are described in Section KPI Normalization.
Each KPI is transformed into a Unit Score, corresponding to one, and only one, KPI.
To further simplify the interpretation the result of multiple benchmarks, these Unit Scores can be aggregated to form Group Scores. They represent the overall performance accross multiple indicators, generally evaluating the model for similar physical processes or on the same data.
The Total Score is the aggregation of all group scores into one, and only one, score, representing the overall performance of the model for the studied case.
Figure 1 shows an example of normalization of each KPI for the case FB001. Each KPI is normalized into a Unit Score. Then Unit Scores are aggregated into two Group Scores representing the overall performance for Building Damaged benchmarks and Burn Severity benchmarks. Finally, both Group Scores are aggregated to form the Total Score.
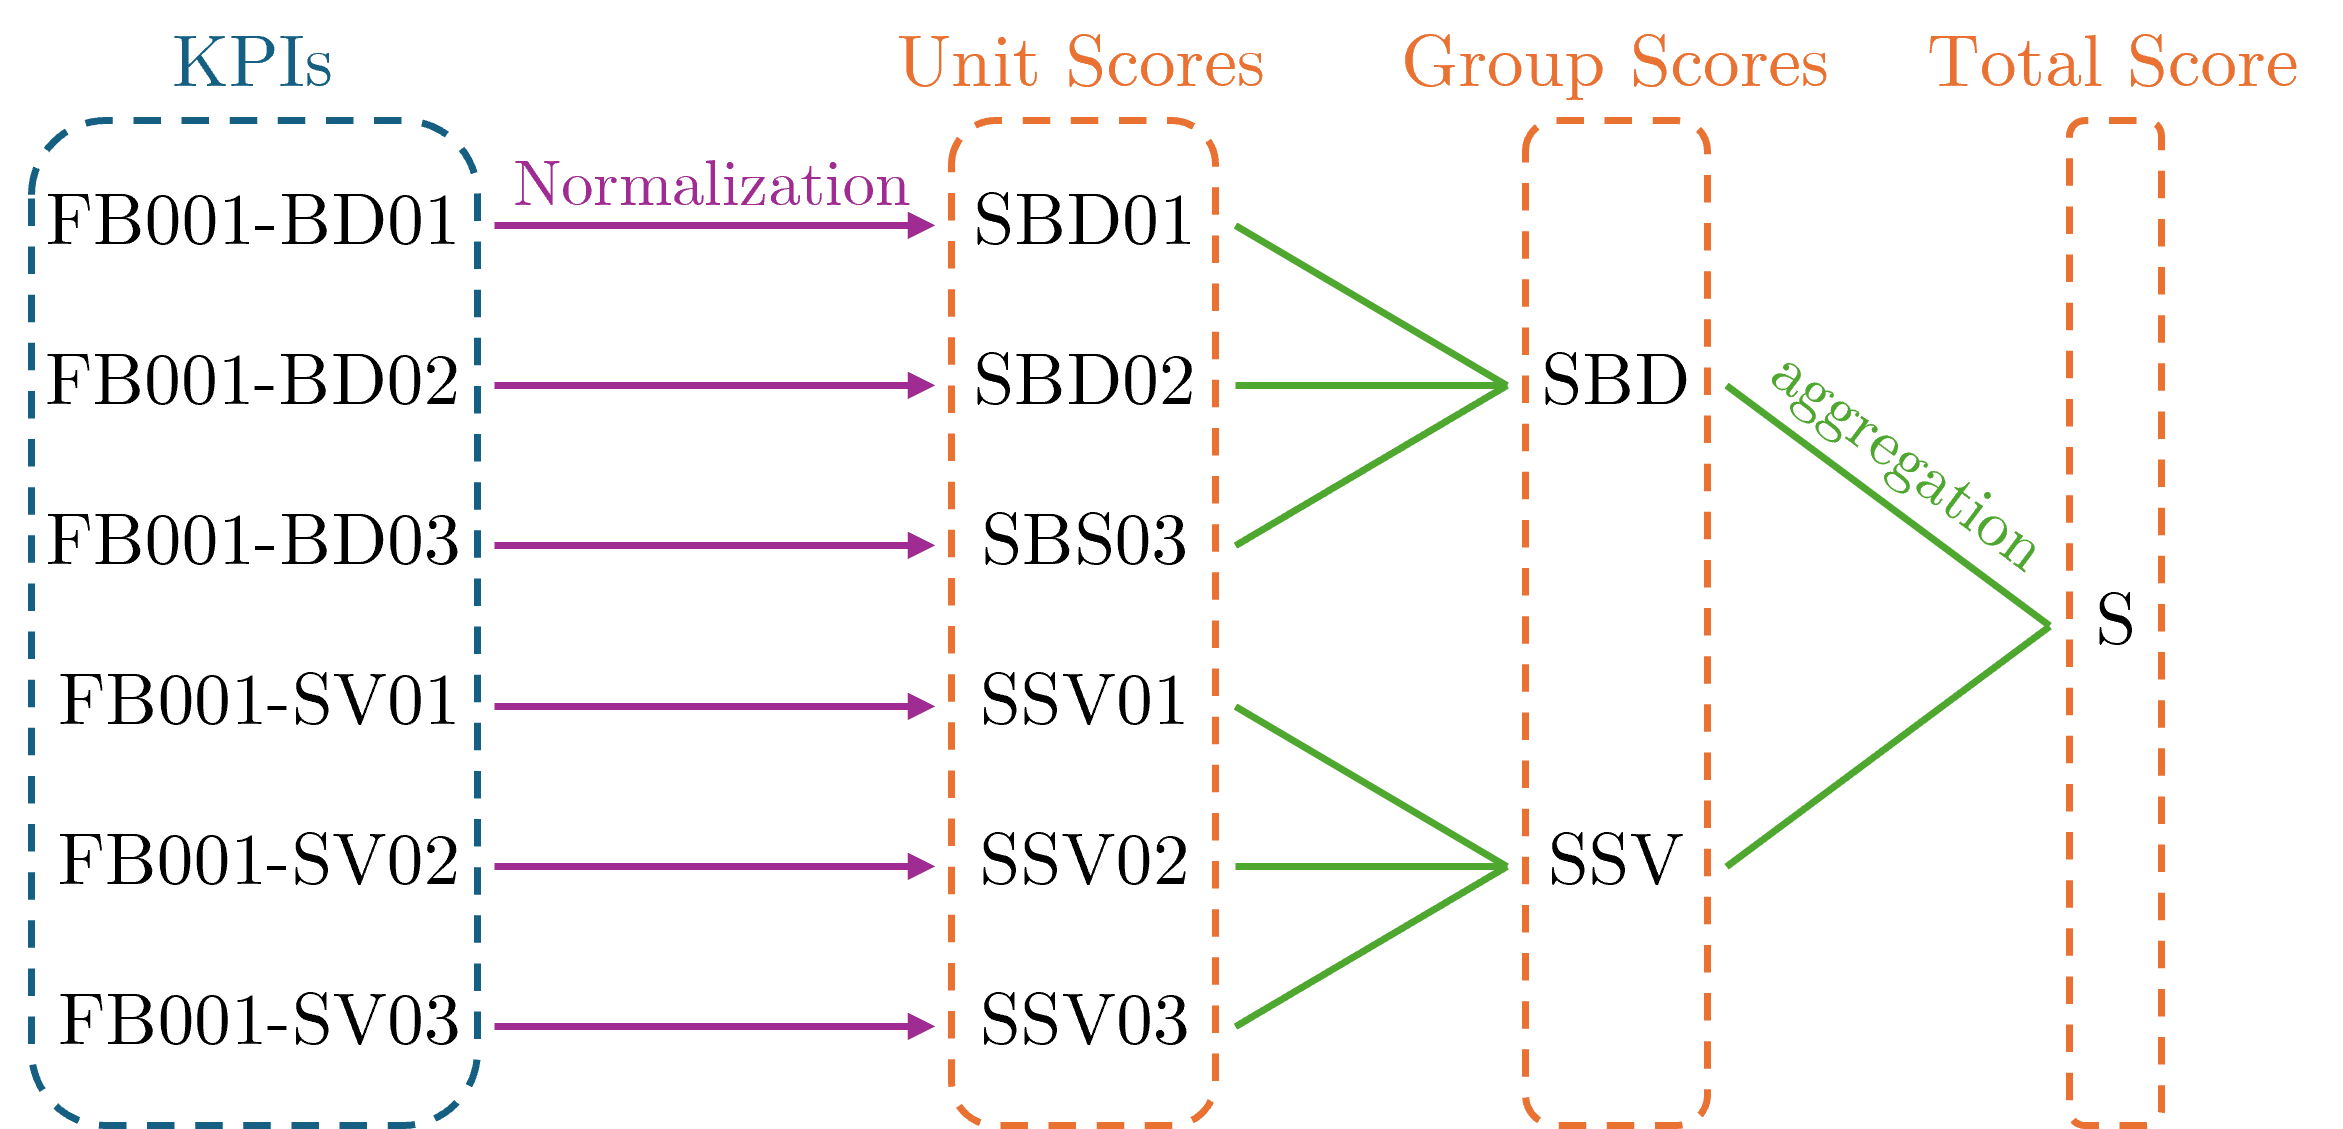
Fig. 1 : Diagram of Scores construction from KPIs using two categories of KPI (BD: Building Damaged, SV: Burn Severity).
The aggregation can be performed using multiple aggregation schemes. The simplest scheme is to aggregate score using a mean function. This gives the same weight to each KPI in the Total Score. We can also develop more complex aggregation schemes to give more weight to certain benchmarks/KPIs. Therefore, for each benchmarking case (collection of dataset and KPIs), we can define multiple aggregation schemes to evaluate different classes of models. Each aggregation scheme will be noted using a letter. For example FB001-A, FB001-B.
Figure 2 shows exmaple of KPI values and their correspond range between brackets. The KPI FB001-BD01 has a value of 0.34763 and a range of [0, 1] (FB001-BD01 can represent a binary confusion matrix index), whereas the KPI FB001-SV03 has a value of 3.489 and a range of [0, \(+\infty\)[ (FB001-SV03 can represent an absolute bias). All KPI with a limited range of values are normaized using the linear normalization function (see next Section). The KPI FB001-SV03 is normalized using the linear semi bounded normization function with a parameter \(M=5\), which means that if the KPI value is above 5, the score will be 0. Then, Unit Scores are aggregated using uniform weights (represented by the green numbers above aggregation lines) to form Group Scores. Finally, a weighted aggregation is performed to calculate the Total Score of the case, giving an double importance to benchmarks related to *Building Damaged. The list of aggregation scheme and their weights are explicitely defined in the case documentation.
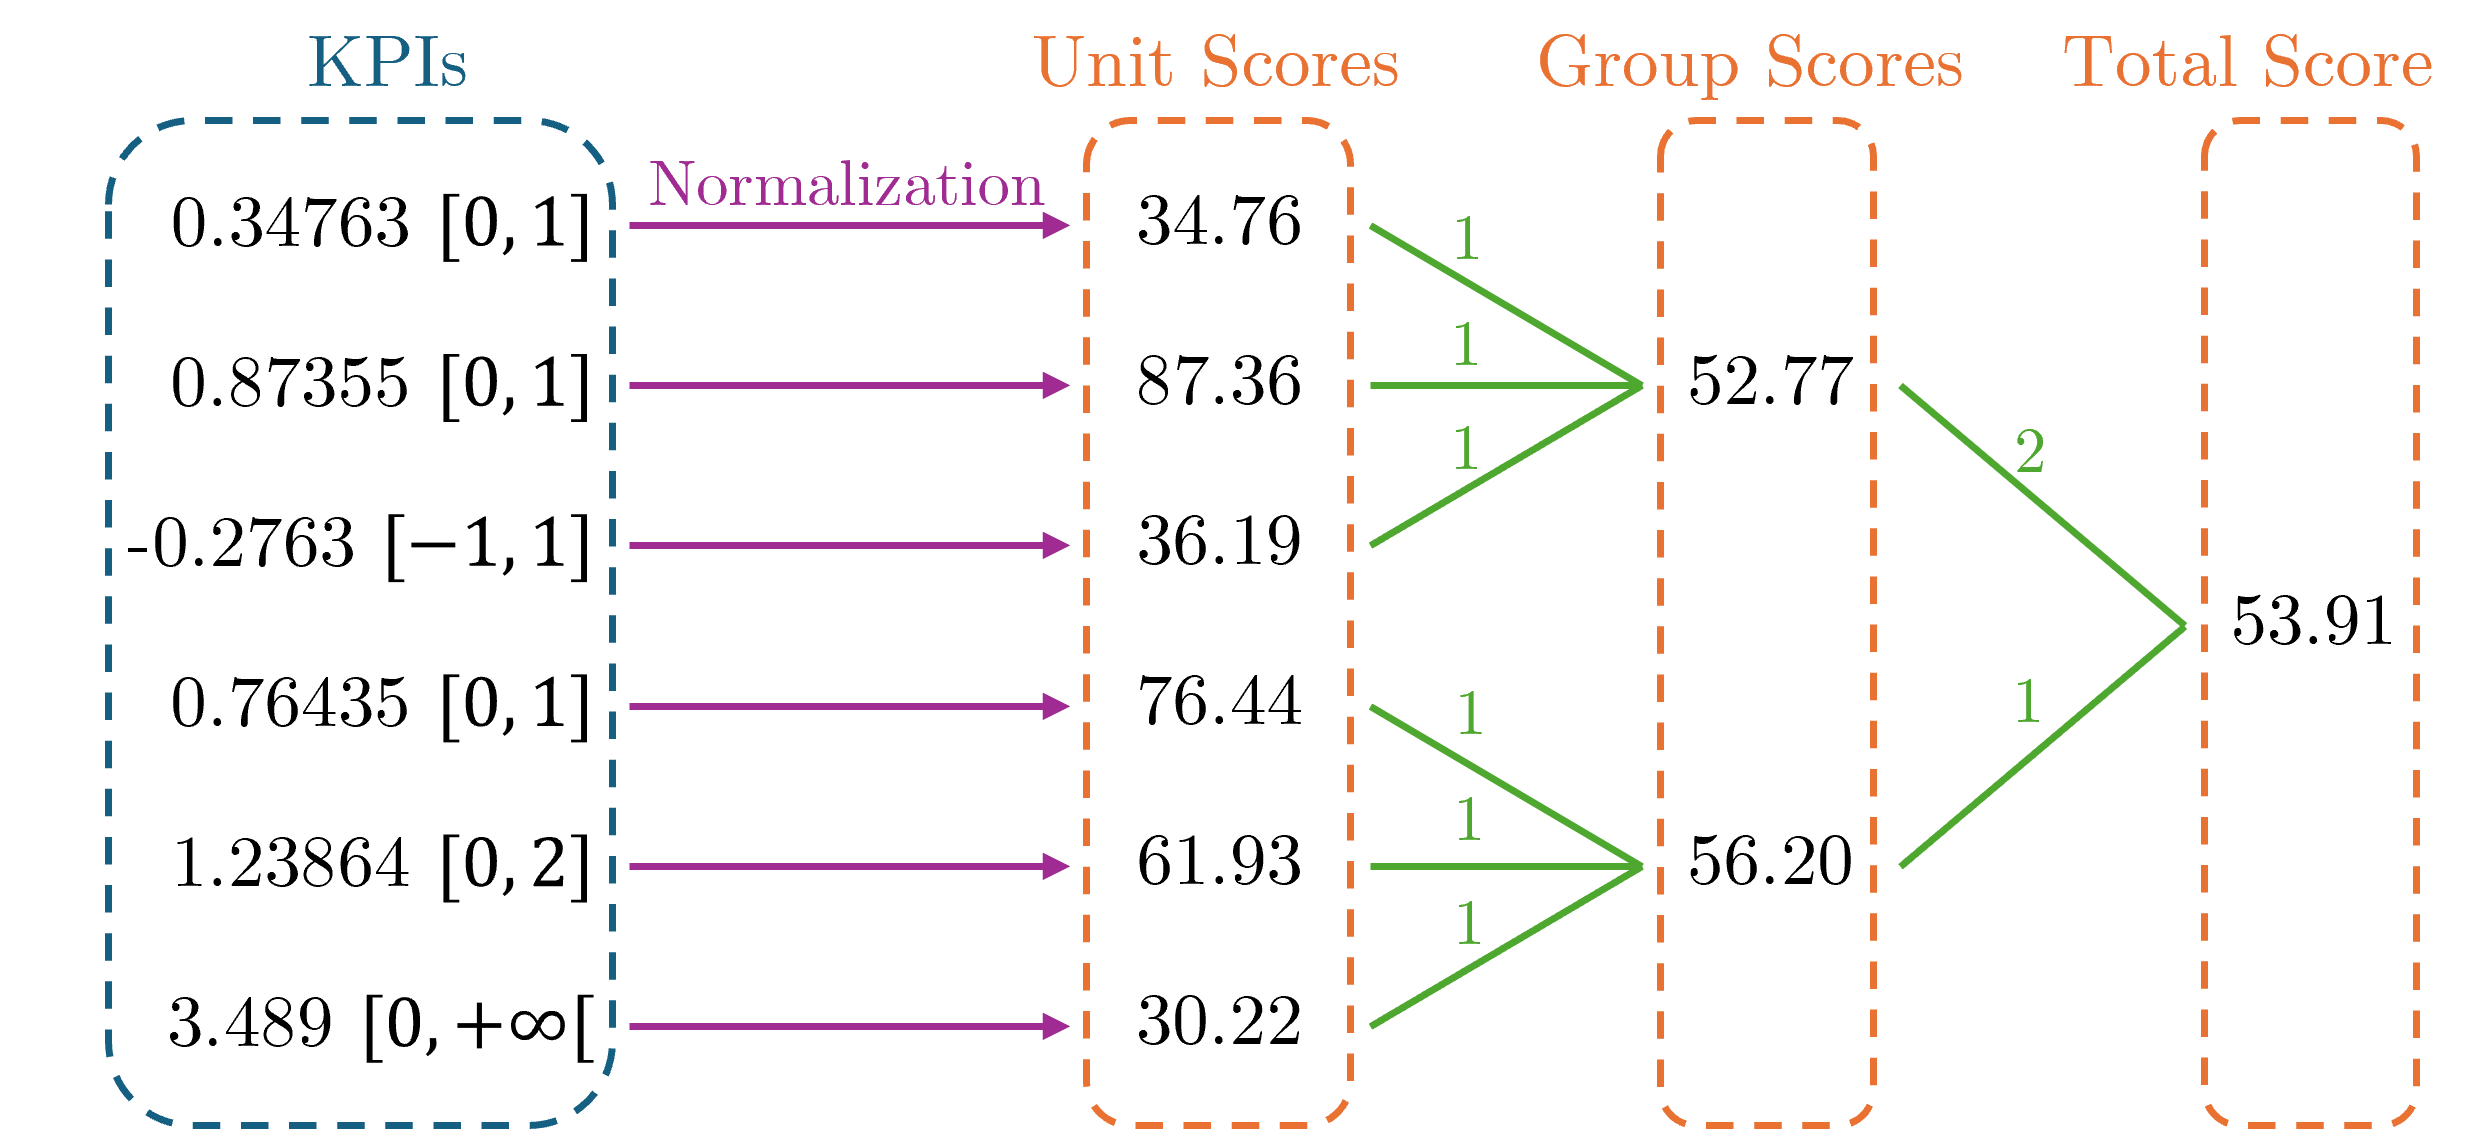
Fig. 2 : Example of Scores construction from KPIs using two categories of KPI.
Figure 3 displays an Score Card that is a table representing the data showed in Figure 2. This type of score card can become the standard of presentation for case results. The first row shows the total score and contains the case that has been run (FB001), the aggregation scheme used (B, defined in the case documentation), the model name, and the total score calculated in Figure 2.
The rest of the table is organized as:
one group row that describes the name of the group and the associated score. A keyword Group is added to emphasis the row.
All the benchmark scores related to the group are displayed after. The name of the benchmark is added as a reference. Here the case id (FB001) is omitted for clarity as it is already displayed in the first row.
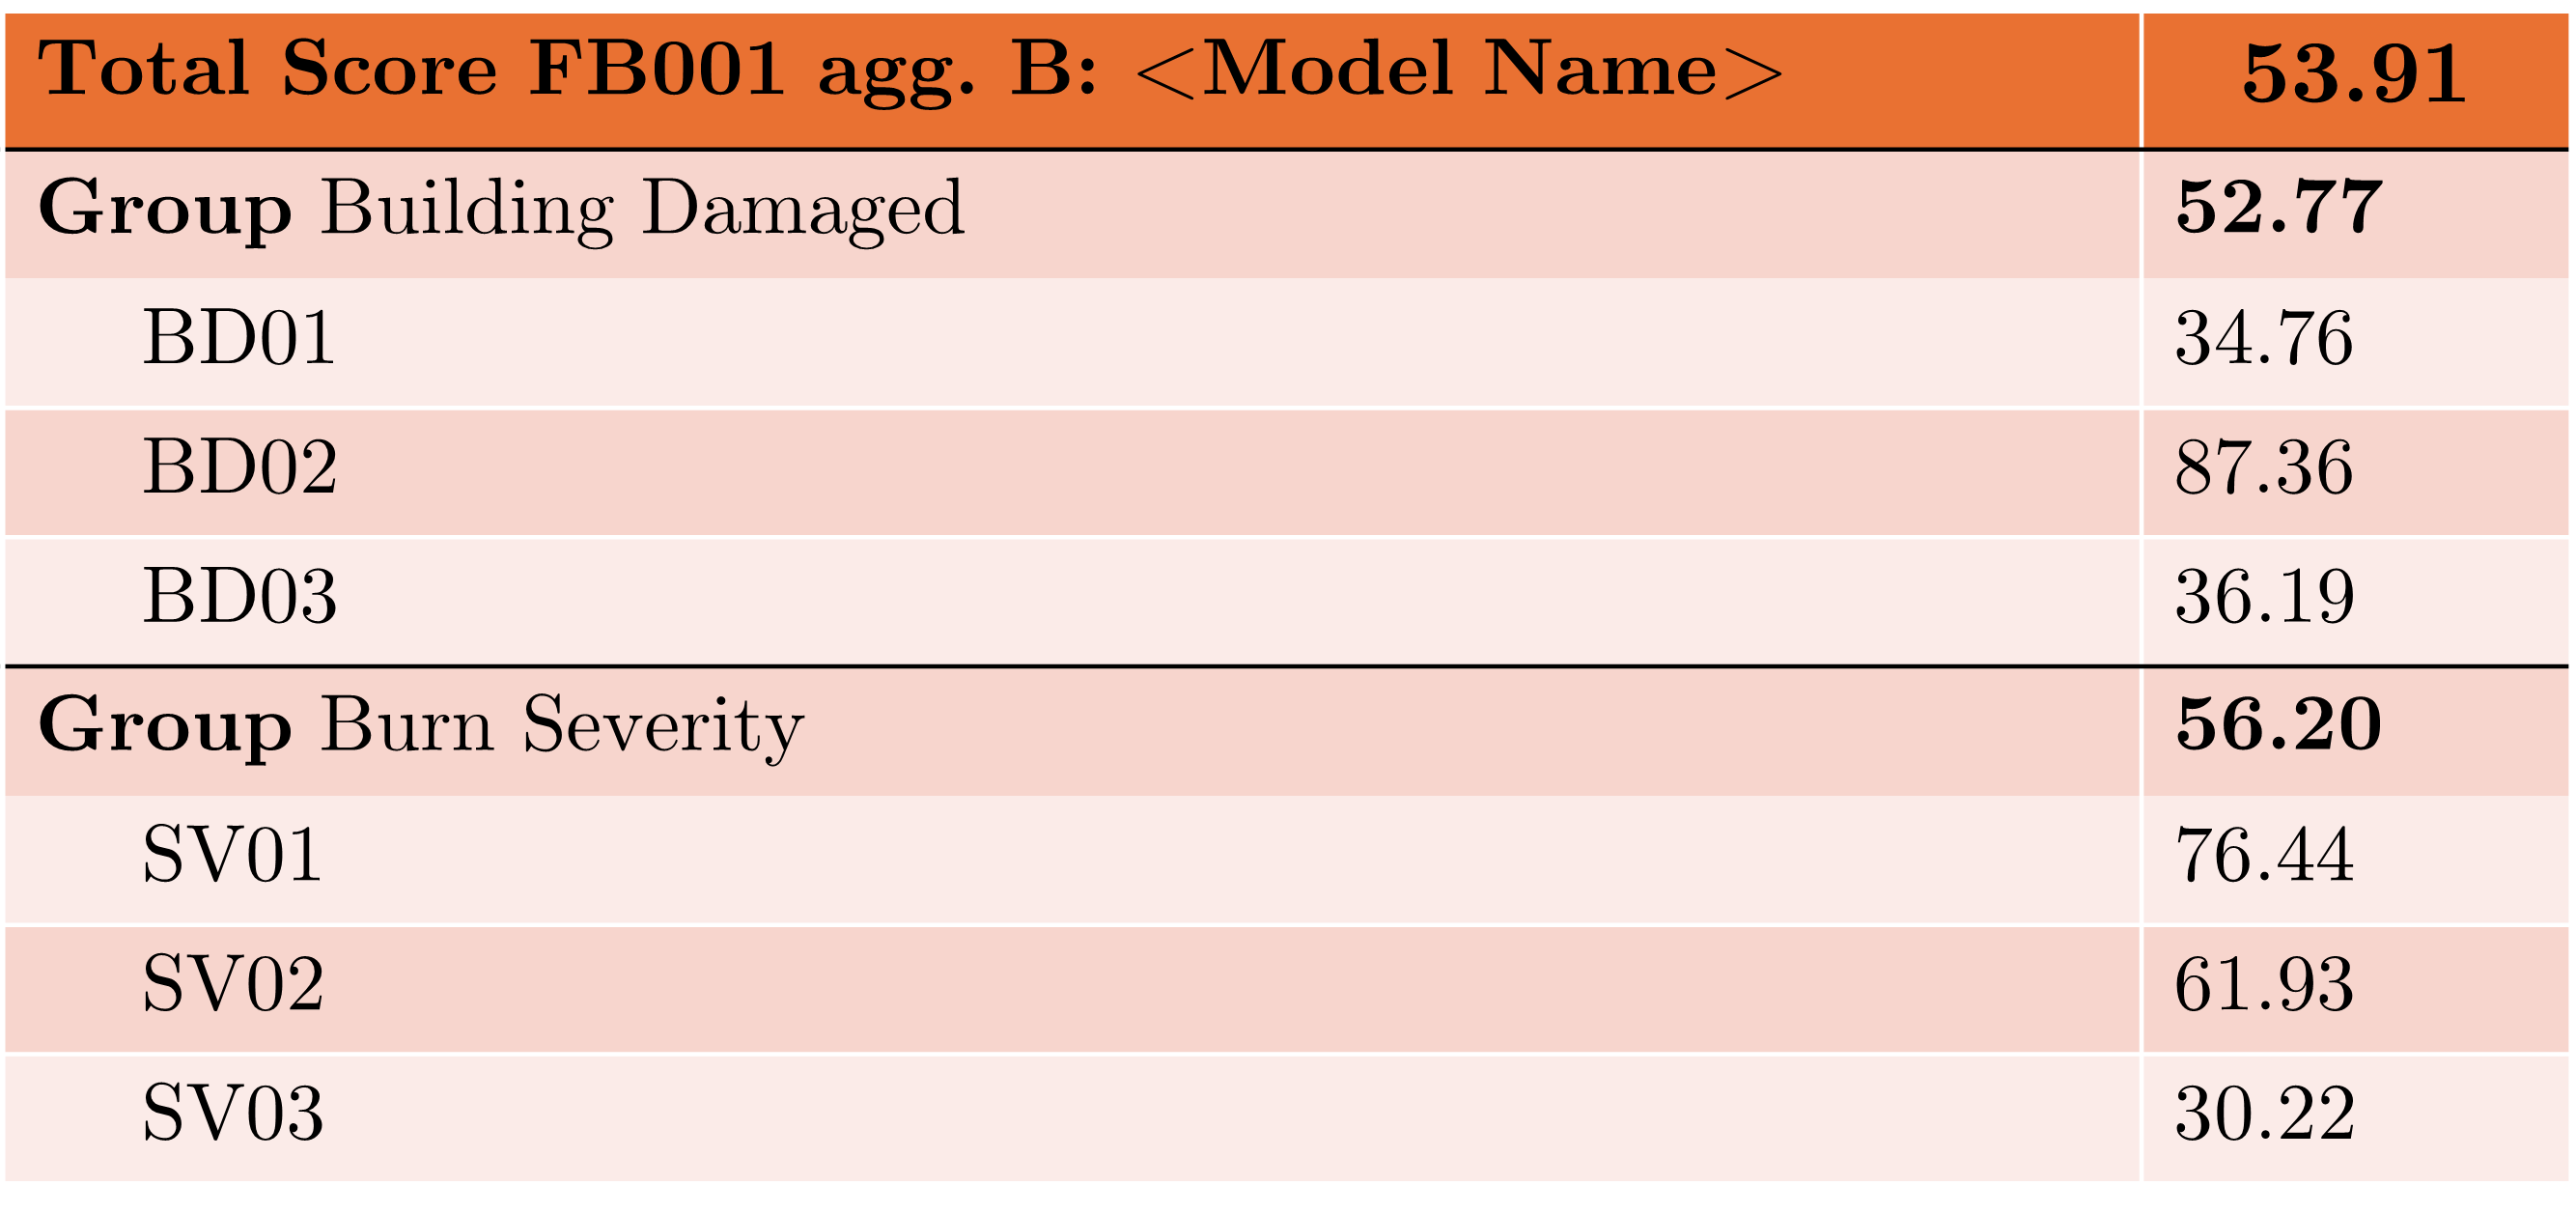
Fig. 3 : Example of Score card layout
Note
Note: The example here above are not related to the real case FB001 (Caldor Fire) and all KPI names and values are given as examples.